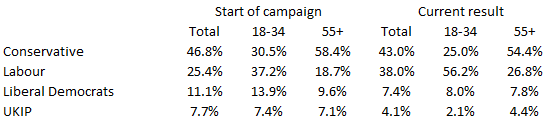
With four days left to go, my trend measure of British opinion polls finds the gap continuing to narrow, with the Conservatives down 0.9% since last week to 43.0%, Labour up 2.6% to 38.0%, the Liberal Democrats down 0.5% to 7.4%, and Ukip up 0.1% to 4.1%. The Conservative lead of 5.0% is 1.5% less than the 2015 result, a swing that would give Labour a net gain of 10 seats from the Conservatives in England and Wales if uniform.
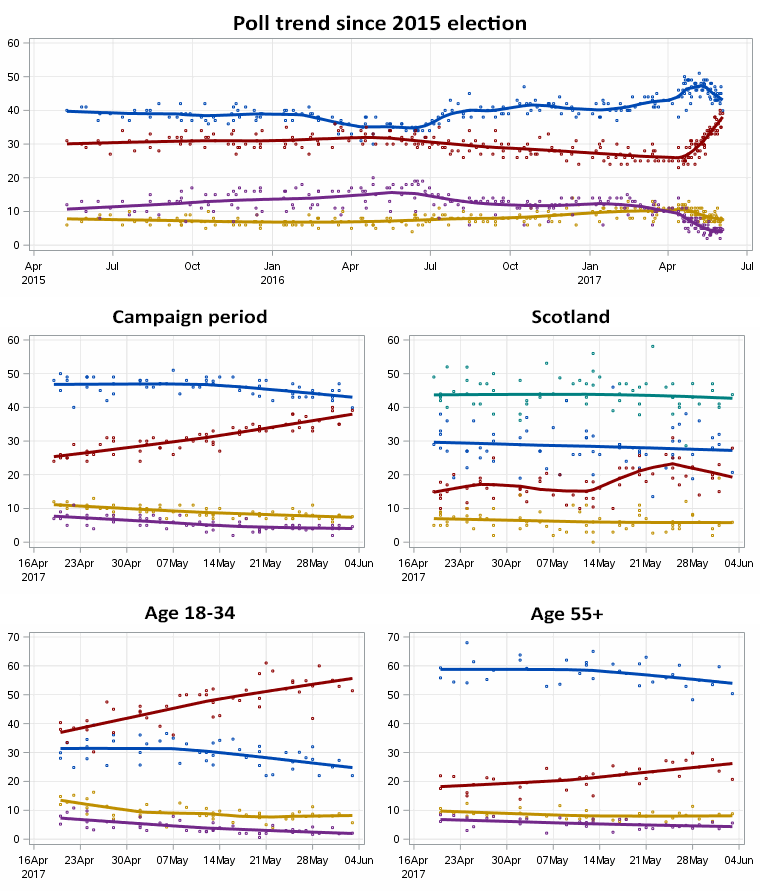
Then there’s Scotland, where a separately conducted poll trend calculation produces results of Scottish National Party 42.7% (down 7.3% on the 2015 election), Conservative 27.2% (up 12.3%), Labour 19.3% (down 5.0%) and Liberal Democrats 5.8% (down 1.7%). However, the error bars here are rather wide — most of the data points are small sample breakdowns from national polls, with the most recent Scotland-specific poll, from Ipsos-MORI a week ago, having Labour and the Conservatives level on 25%. For what it’s worth though, crudely applying these swings to the 2015 vote shares results in the SNP dropping eight of their 56 seats, with seven going to the Conservatives and one to the Liberal Democrats.
All told, that suggests a result of 327 seats for the Conservatives, down from 330 at the 2015 election, and 242 for Labour, up from 232, out of a total of 650 — assuming no change to the Liberal Democrats’ seven seats in England and Wales, and making no effort to account for the 18 seats in Northern Ireland.
As I discusssed at length in Crikey on Friday, the more interesting story to emerge from the polling is the disparity between voting intention of younger and older respondents, such that pollsters’ findings are heavily dependent on the relative weightings they apply to them. This is demonstrated in the chart below, which records Labour’s gain among respondents aged 18-34 has been twice as great at among those aged 55 and over, from a base that was already remarkably wide to start off with.
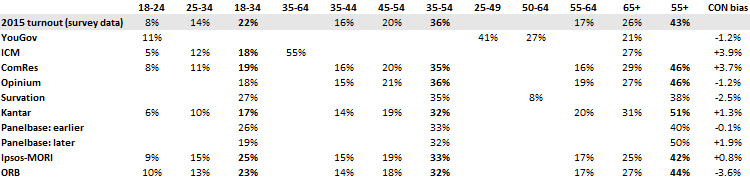
Age loomed large in the polling industry’s failure at the 2015 election, with Anthony Wells of YouGov and UK Polling Report observing that the single biggest issue was that pollsters surveyed “too many younger people who were too engaged and too interested in politics”. Broadly speaking, one of the approaches to dealing with this issue has been to construct turnout models based more on the age and class structure of the voting population at the 2015 election, as recorded by post-election surveys — and it is these pollsters who have recorded the strongest results for the Conservatives.
ComRes, ICM and Kantar have followed this pattern throughout the campaign, while Panelbase has done so since a methodology change that has applied to the latest two out of their six campaign polls. The effect in each case has been to downweight younger respondents, and hence support for Labour. If Labour’s hope of a turnout surge among younger voters is borne out, these polls will no doubt be found wanting.
Indeed, various other methodological adjustments by these pollsters appear to be producing a turnout population that is somewhat older than that in 2015 (see table below). In the case of ICM, which is weighting by self-identified political interest levels, one recent poll was calculated by Wells as producing a Conservative lead eight points greater than would have been the case using the pollsters’ 2015 models.
Survation, which famously produced an accurate result on the eve of the 2015 election but shied away from publishing it, has not made any radical changes to its methodology, which continues to rely heavily on self-identification for turnout. Its age structure has varied considerably from poll to poll, but overall it has projected stronger turnout among the young than in 2015, and has accordingly produced strong results for Labour.
ORB appears to be splitting the difference between self-identification and turnout by age and education as recorded in 2015, and has produced the strongest results of all for Labour — albeit that this is heavily influenced by one outlier result in late April, when it recorded a Conservative lead of a mere 11%, as opposed to the trend measure of 19.6% at that time.
YouGov has received considerable attention for its strong results for Labour late in the campaign, but it has only been since mid-May that any such lean has been evident. This pollster has sought to redress the failings of 2015 by weighting by self-identified political interest level and education qualification, again with the aim of matching their results to post-election surveys. Its age model makes it hard to compare with other pollsters, since it uniquely breaks the middle groupings into 25-49 and 50-64 cohorts. However, its modelled turnout population looks more like the population at large than turnout in 2015.
Another big-name pollster, Ipsos MORI, has persisted with weighting by self-identified likelihood of voting, and accordingly has a young turnout model as compared with the 2015 election. However, this has not translated into particularly strong results for Labour, albeit that it has only published three results in the course of the campaign. The pollster has sought to address the industry-wide problem with over-representing the heavily engaged by weighting by education and newspaper readership, and using a range of indicators to exclude potential non-voters.
Opinium has been an odd man out in that its age breakdowns resemble those of ComRes, ICM and Kantar, but it has not produced correspondingly strong results for the Conservatives. Whereas the latter pollsters have purposefully weighted to a specific age model, Opinium appears to have achieved a similar effect through weighting to reported vote in 2015.
For further illumination on these matters, the following table shows how much weight each pollster has given to its various age cohorts, using averages of their polling over the campaign period. The final column is an averaged measure of how much the pollsters’ recorded Conservative leads have differed from the trend measure.
And finally, self-explanatory trend charts with the Conservatives shown as blue, Labour as red, Ukip as purple, the Liberal Democrats as gold, and the Scottish Nationalist Party as teal.
Whatever the result, Corbyn has done a lot better than his critics on both sides expected him to.
Conviction politics is what its about, voters respect politicians who stick to their principles. Coryn stuck it out in difficult times, May saying what she thinks people want to hear.
YouGov seat update
Conservative 304
Labor 266
LDP 12
SNP 46
PC 2
Green 1
Indep 1
Speaker 1
NI 18
Making some big assumptions:
Cons + Unionist + Speaker = 315
Labour + SNP + LDP + PC + Green + Indep + SDLP = 331
SF Absent = 5
The trend continues
Re the earlier about labour-uncut website
In the last week of the 2015 campaign, with the polls tightening to dead-heat territory, this website/this same writer wrote an article based on discussions with campaign insiders:
He said the canvass returns weren’t jiving with the polls and that early sight of some postal votes (in theory they remain secret, in reality the scrutineers can see what’s what) were pointing to a very bad night and that the expected gains in the English marginals were not going to happen.
I didn’t like his message then, or now, but I would put money on him being right again.
Full disclosure – lifelong Labour party member and I am voting Labour this time.
My lifelong Labour-voting brother and mother are voting Tory this time “because of him”
Boerwar, will you leave off the Corbyn-bashing until AT LEAST Thursday night? Let’s look at the obstacles Corbyn has faced since becoming Labour leader:
– A Parliamentary party hierarchy implacably opposed to, and desirous of undermining, his leadership;
– A Party staff intent upon the same end (namely, the handover of leadership to a Tory-lite Blairite, nevermind that Blairism is discredited, Miliband lost the 2015 election in a landslide and Blair himself is a war criminal);
– A constantly, consistently hostile press, c/o Rupert Murdoch;
– A snap election (which I agree he should really have blocked); and
– The constant abuse by the Tories of the power of governance for partisan purposes.
Between all of those and the 20-point lead Theresa May enjoyed when she decided to call a snap election (right after breaking her promise to serve out the full 5-year term!), I’d say it’s little short of a miracle that Corbyn’s Labour is polling at 38% – which, I remind you, represents an 8% swing TOWARD Labour if it’s carried out at the ballot box.
Every Scottish person I have spoken to over recent weeks has been aggressively pro-SNP. The SNP as far as I understand it have one major political objective, Scottish independence. If Corbyn wins he may have to introduce a vote earlier than expected on this issue, as the only way he can form government is with their support, so unfortunately I believe if he does pull it off he’ll forever be remembered as the PM who lost Scotland which I think is going to tarnish his reputation. What an unfortunate situation. Of course, losing has its downsides too. I doubt UK Labour will ever take another chance on such a far left candidate again and the impression I get internationally is that what the left really wants are truly progressive candidates that they can rally behind. Even winning government is losing for UK Labour in this context.
May is an example of an over the top media coaching gone bad.
In this day and age, we’re used to politicians being media coached and trained to say the things that have been PR-tested to resonate with the public, and the good ones among them know when to speak from the heart when it matters (while avoiding using certain words or actions). However, when confronted by the media and by her opponents, May just keeps on hammering the same key phrases, hence the criticism of “May-bot” and perhaps why we see her refusal to participate in debates with other party leaders.
I’ll be lying if I were to say that Corbyn is 100% not media coached.
As much as I’d like to see Labour win, I think it’s unlikely that Corbyn will win a majority in his own right unless some serious polling catastrophe happens to the Conservatives within the next 2 days. I’ll be thrilled to see May manage negotiations towards a disastrous minority government, giving Labour a chance in the next election after.
Charting the responses to a Corbyn victory by unreconstructed Blairites. (May it come to pass).
Blanket Criticism
“I believe if he does pull it off he’ll forever be remembered as the PM who lost Scotland.”
It’s the Tories who are most responsible for that. But Scotland will still be there, in Europe. 🙂
Under no circumstances do I think UK Labour would form a coalition, or unofficial ‘guarantee supply but don’t call it a coalition’ coalition with the liberal democrats so if OC’s speculative result is correct I think the best UK Labour can hope for is 319 to 315. which means that much of their decision making is going to be in the hands of independents. What a shitshow.
In the words of 80s pop outfit Alphaville I am ‘hoping for the best, but expecting the worst’.
Well, the Tories will have East Yorkshire sewn up!!!
https://www.youtube.com/watch?v=Gt7lWRtfve8
Much is being made of how differnt polsters are estimating youth turnout and are attributing the different results to that weighting. I think it is more fundamental than that and the situation is that the Yougov pool that it is drawing from has a left bias.
I took a look at the voting intentions across the various companies.
I put their figures into 3 categories Con, Lab, Other Party (ignoring don’t know or won’t vote).
I did this only for the 18-24 range so there is no weighting or other adjustments. This is how it came out.
14.86% 59.46% 25.68% ICM
24.06% 59.36% 16.58% Comres
23.85% 53.56% 22.59% Survation
24.95% 56.14% 15.56% Opinium
15.15% 71.72% 13.13% Yougov (most recent)
19.00% 69.00% 12.00% Yougov (previous)
Whilst 4 reputable survey companies have this age group voting Labour at a rate of between 54-59%, Yougov has them at 69-72%.
With Yougov also having one of the highest estimated turnouts for the 18-24, and Yougov also publishing polls most often, the error is in effect magnified.
My money is on a shy Marxist effect. I don’t think the polls have picked up the huge number of commies (including Soviet sleeper agents) who have been masquerading as Home County Tories all their lives. At this election, they’re gonna come in from the cold and push Corbyn over the line. You know it makes sense (or at least, as much sense as every other theory)
IfOnly – But isn’t it the case that ICM has basically just taken the turn-out from the last election (43 per cent) and plugged that in? Further, I understand that YouGov had made a much greater attempt than other pollsters to get representative samples by interviewing less politically active voters. ICM, on the other hand just does a huge tweek to compensate for any potential bias
@ Ifonly – I think that still comes down to the same issue – the degree to which pollsters use 2015 patterns vs stated voting likelihood.
Specifically, I believe you are mistakenly believing that pollsters determine an expected turnout for an entire age cohort, and apply that turnout to all people in that cohort.
That is not how it works (to the best of my knowledge). The pollsters determine a likelihood to vote for each person based on a number of cohorts they belong to (age, education, prior voting, newspaper readership), and use present summaries of those voting cohorts.
So basically, what this comes down to, is that Labour leaning youth are stating a higher degree of ‘likely to vote’ than Tory leaning youth are. Yougov is believing this to a fairly large degree. The pollsters you mentioned are not believing it to any degree.
So, there’s two questions to ask.
1) Do you believe youth turnout is going to increase?
2) If 1) is a yes, then do you believe this is (a) because of some sort of generational change, or is it (b) due to youth responding positively to Labour policies and/or personalities, and/or responding negatively to Tory policies/personalities.
If you believe the answers are ‘yes’ and ‘b’ respectively, then Yougov’s methodology is correct.
You joke, but I think growing income inequality is turning a lot of ordinary people Marxist. Problem is it’s only happening in the generations that aren’t past retirement age or who had well established careers before the GFC. Anyway after the result Friday we’ll see which of the many theories turns out to be the correct one.
*didn’t have
Antonbruckner11
Voice Endeavour
No, those figures are not affected by turnout pattern. The turnout pattern might be 60% for 18-24, 70% for 25-49 etc but those adjustments don’t impact the original source data within an age group only how much that agegroup impacts the whole.
So for example, ICM was 11, 44, 19 in actual numbers, Comres 45, 111, 31. It doesn’t matter if you assume only half of them will turnout or all of them. The ratio is the same. Yougov was 15, 71, 13 and previous Yougov was 19,69,12
@IFOnly
Comres’s youth vote was 45 Tory, 111 Labour, 31 other, 20 don’t know or prefer not to say, and 25 people who we don’t know what their answer would have been because they were not even asked who they were going to vote for because they were not deemed ‘likely to vote’. They asked 232 young people how likely they were to vote, but only asked 207 young people who they would be likely to vote for. It looks like they excluded anyone who answered 1,2,3 or 4 for ‘likelihood of voting’ and only counted those who answered 5+. Apart from the last sentance, which is speculation, this is from the question
Q2. If there were a General Election tomorrow, how likely would you be to vote on a scale from 1 to 10, where 1 means you are certain NOT to vote and 10 means you are absolutely CERTAIN to vote?
Base: All respondents
Q3. If there were a General Election tomorrow to elect MPs to Westminster, would you vote Conservative, Labour, Liberal Democrat, UKIP, SNP, Plaid Cymru or for some other party?
Base: All likely to vote
ICM asked the same number of people how likely they are to vote as who they would vote for.
QB. The Conservatives, Labour, the Liberal Democrats, UKIP and other parties will fight the General Election in your area on June 8th.
Which party will you vote for in the General Election on Thursday?
Base: All respondents
Yougov asked the same number of people how likely they are to vote as who they would vote for, but they used a weighted average, so that people Yougov believe are more likely to vote are treated as more important in the average than people who aren’t likely to vote.
“[Weighted by likelihood to vote, excluding those
who would not vote or don’t know or are not
registered]”
As I said, this could easily be caused by how the Pollsters handle likelihood of voting. There is no need to assume biased samples to explain this.
I found an interesting comment on a UK blog. This guy’s basic proposition is that the UK pollsters don’t really understand or properly deal with the Do Not Know or Will Not Vote Category. This, he thinks, is the well out of which Corbyn is drawing a lot of his support (not voters switching from other parties).
If that is the case, how many more will he draw out on Thursday. It adds to the uncertainty, anyway.
“Pollsters ask about support for labour and conservatives and dismiss those who do not intend to vote. But that is 1/3 of the population being dismissed, enough to create an entire third party without taking any voters from the big two.
Several posters both here and elsewhere glide over the fact that the accepted way of presenting polling results ignores the undecided or those boycotting the vote. As I posted before about whichever poll was the subject then, the opinium poll which is the subject of this thread ought to read con 43%, lab 36%, lib 8%, UKIP 5%, dont know 20%, will not vote 30%. A total of 150%. (approx)
When discussing whether labour support has grown by sucking up lib, green or even UKIP, people are prone to miss that much of it has come from ‘dont know’, or even in the case of new electoral registrations, ‘will not vote’.
When the analysis is done why polls were misleading about the position at the start of this campaign, they will concluded that there was significant hidden support for labour in the tally expressing no intention to vote for anyone. Yet a fraction of these people were always most likely to return to labour, because their past VI said this was where they had come from.
I am not sure polling even captures the likely turnout at a given moment in time, but transferring a block entirely out of the group intending to vote, mainly from one party, artificially inflates apparent support for the remaining parties, because the total number of voters is deemed to change. But in reality the total does not change. Conservatives might have thought they were becoming more popular, but their total number of supporters was far more static than the numbers suggested.
But also as I began by saying, while Corbyn might have repelled some labour voters who moved dont know, but then returned because there is an election, he may also have attracted another group out of the DK/WNV who do like his brand of politics but previously had no party to represent them. Either way, this whole reservoir of potential support is not being captured by polling companies.”
The commentariat thinks the Tories will saunter in.
Maybe they will.
But it would be so delicious for a Labour Party lead by Corbyn to win on a number of fronts.
Labour’s one MP from Scotland in May.
That was referring to May the month on May the “strong and stable my arse” PM
Watching the campaign from Australia I have to say I too feel sympathetic to Corbyn after initially labeling him a disaster. It is clear May is a joke and the campaign has demonstrated that.
The Scotland graph is interesting. Labor’s support both climbs and dives without any apparent effect on any of the other trendlines. People switching to/from “don’t know”?
I’m obviously hoping for a Labour victory, but I expect, in the end, the Tories to secure a pretty decent win, with a last-minute surge to them.
But either way, Britain has been poorly served by this election. It’s been a fascinating ride, to be sure (interspersed with the twin tragedies of Manchester and London Bridge), and Corbyn has done better, and May much worse, than anyone expected. But no-one has really addressed the elephant in the room.
The next parliament will be dominated by one issue, and one issue only – Brexit. This process will be costly, complex, and all-consuming (something the great Brirish public seem unaware for now), and we are really none the wiser now than we were in April about how either party will approach this.
Here’s a blog post that lays it all out far more cogently than I could:
http://publicpolicypast.blogspot.com.au/2017/06/the-brexit-storm-clouds-gather-once-more.html
How late will Jeremy Corbyn’s concession speech be? Will he take responsibility for defeat?
Apparently anyone who wants the Labour party to survive as an electable alternative is a “Blairite” now?
Seth,
Yes, it seems anyone who doesn’t back Corbyn is labelled ‘Blairite filth’.
Corbyn has done a great job of managing expectations. Labour will probably have a net loss of seats, for the fifth election in a row, and yet this will be portrayed as some sort of ‘victory’, simply because the Tories didn’t end up with the 200 seat majority it looked like they could get a couple of months ago.
Swamprat – We are presently seeing the greatest piece of pollster in the history of polling. Even YouGov has cut and run. They’re all just worried about their stock prices if they get it badly wrong. It’s hard to trust any of them. I won’t be the slightest bit surprised if Corbyn gets to a hung parliament – but we will see.
Sorry. “We are presently seeing the greatest piece of herding in the history of polling …”
Polls point to a decent conservative win but hung parliament is still possible. There have been numerous changes to methodology during the campaign which blunted Labour support. A lot seem to expect conservatives to beat their polls but polls have already been tweaked heavily to address issues in 2015.
I’m predicting a hung parlt. May to resign as tory leader & mayhem the result.
Jeremy to float to the top & lead a minority govt.
SM – I’m with you.
A major reason that Theresa called this poll was to get a thumping majority so she could sideline the hard-brexit loonies in her party (who would rather pay tariffs to export to Europe than end up a de-facto member of the EU complying with EU regulations etc etc). Doesn’t look like that is going to happen. So, if she forms a government and if she wants a soft-brexit, she will have to get Labour to vote for her deal!
Though, on the other hand, she’s such an insecure idiot she’ll probably crash out of the EU without a deal, just to look tough.
AntonB
Ha “herding”, yes.
I must admit, i find the UK polls all over the place but i am psephologist.
Those who think Labour will win by becoming right wing or red Tories only have to look at the gang running SLab and their political standing.
Quite a few Scots who vote SNP do not support independence.
The SNP has other policies which are pretty attractive to many voters.
Its the Yoons who endlessly go on about independence.
Indeed the tories in Scotland have one policy: to stop scots having a vote on independence!! SLab is not much better.
NO psephologist ……… that should be
Swamprat- They only have to look at what happened to the French Socialist Party when it became Tory-light. It almost ceased to exist at the last election.
Crikey’s Helen Razer article on Corbyn.
Reading it, now I kind of understand why there’s an active campaign against him by some bludgers and I may have got dragged into the whole negativity.
https://www.crikey.com.au/2017/06/08/razer-and-corbyn-sitting-in-a-tree-m-a-r-x-i-s-m/#comment-355763
silentmajority @ #82 Thursday, June 8, 2017 at 2:00 pm
I think we might see in a few months time that the UK PM will be neither oh the leaders of the two major party, though I believe there is a chance that May may arrogantly stay on and go down with the ship.
Raaraa – It will be interesting to see if the pollsters have failed to capture a lot of Shy-Corbynists, rather than Shy-Tories this time!
Raaraa – Go down with the ship? After this election, they’re gonna tie an anchor to her leg and toss her overboard!
I wonder which election outcome, if any, will result in the biggest boost to the value of the £?
I would assume that May’s PMship will last an additional:
Labour majority or minority or coalition: hours-days
Tory minority or coalition: 1 weeks – 1 month
Tory small majority (340 seats or fewer): 1 month – 1 year
Tory modest majority (341-370 seats) – 2-4 years
Tory significant majority (371 seats plus) – 5 years+ depending on next election
Bonza – There is a theory that a Labour victory will be better for the pound because it will mean a soft brexit!
I hope this one is right, Labour in front and with a decent sample sizehttp://www.wired.co.uk/article/election-polls-labour-conservative-winner
Thanks Anton, fingers crossed then!
@Womble
Seen a few others that point to the conservatives retaking the lead. This is a real crapshoot.
It’s 7.06am in the UK right now and the polls have just opened. They will close at 10.00pm, or in about 15 hours. Can we have a live coverage thread please WB?
Here’s a discussion about exit polls and why they are usually pretty reliable.
https://www.ft.com/content/0e38ae9e-4a16-11e7-a3f4-c742b9791d43?mhq5j=e3
womble @ #94 Thursday, June 8, 2017 at 2:51 pm
Wow, that’s just crazy. Obviously, it’s all still within the MoE, and will be averaged out with all the other polls, but to compare this with what we had at the start of the campaign, it was just unheard of.
A guy I follow on twitter is going around to every newagency nearby, buying all their stock of The Sun and Daily Mail and burning them all. I must admit, it’s an interesting form of campaigning.