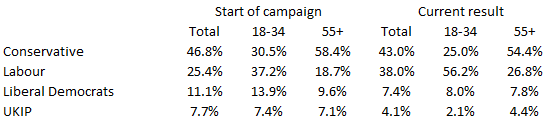
With four days left to go, my trend measure of British opinion polls finds the gap continuing to narrow, with the Conservatives down 0.9% since last week to 43.0%, Labour up 2.6% to 38.0%, the Liberal Democrats down 0.5% to 7.4%, and Ukip up 0.1% to 4.1%. The Conservative lead of 5.0% is 1.5% less than the 2015 result, a swing that would give Labour a net gain of 10 seats from the Conservatives in England and Wales if uniform.
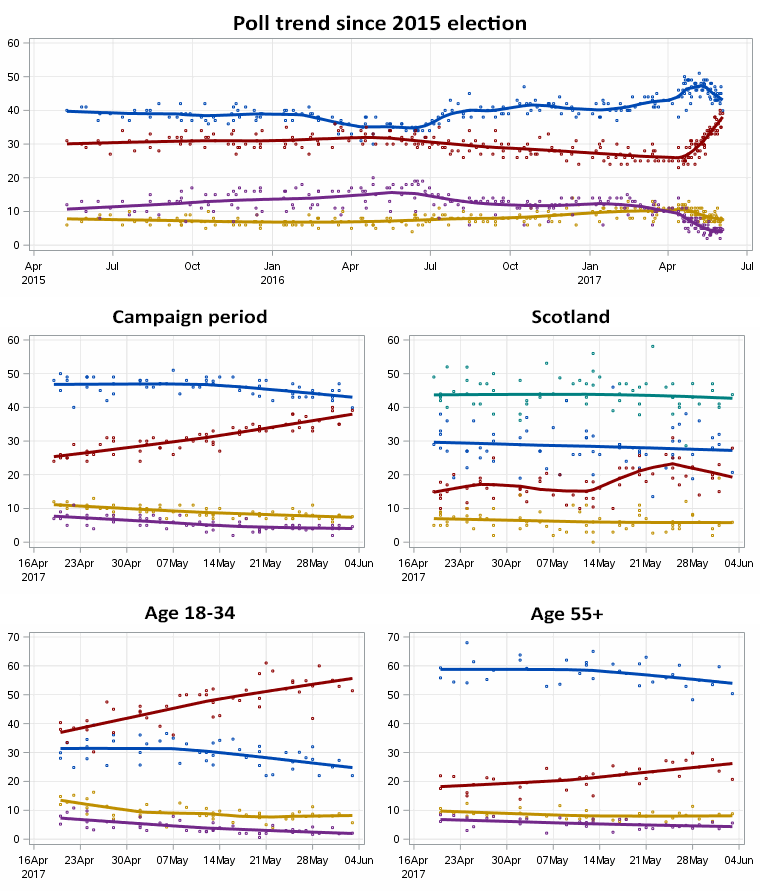
Then there’s Scotland, where a separately conducted poll trend calculation produces results of Scottish National Party 42.7% (down 7.3% on the 2015 election), Conservative 27.2% (up 12.3%), Labour 19.3% (down 5.0%) and Liberal Democrats 5.8% (down 1.7%). However, the error bars here are rather wide — most of the data points are small sample breakdowns from national polls, with the most recent Scotland-specific poll, from Ipsos-MORI a week ago, having Labour and the Conservatives level on 25%. For what it’s worth though, crudely applying these swings to the 2015 vote shares results in the SNP dropping eight of their 56 seats, with seven going to the Conservatives and one to the Liberal Democrats.
All told, that suggests a result of 327 seats for the Conservatives, down from 330 at the 2015 election, and 242 for Labour, up from 232, out of a total of 650 — assuming no change to the Liberal Democrats’ seven seats in England and Wales, and making no effort to account for the 18 seats in Northern Ireland.
As I discusssed at length in Crikey on Friday, the more interesting story to emerge from the polling is the disparity between voting intention of younger and older respondents, such that pollsters’ findings are heavily dependent on the relative weightings they apply to them. This is demonstrated in the chart below, which records Labour’s gain among respondents aged 18-34 has been twice as great at among those aged 55 and over, from a base that was already remarkably wide to start off with.
Age loomed large in the polling industry’s failure at the 2015 election, with Anthony Wells of YouGov and UK Polling Report observing that the single biggest issue was that pollsters surveyed “too many younger people who were too engaged and too interested in politics”. Broadly speaking, one of the approaches to dealing with this issue has been to construct turnout models based more on the age and class structure of the voting population at the 2015 election, as recorded by post-election surveys — and it is these pollsters who have recorded the strongest results for the Conservatives.
ComRes, ICM and Kantar have followed this pattern throughout the campaign, while Panelbase has done so since a methodology change that has applied to the latest two out of their six campaign polls. The effect in each case has been to downweight younger respondents, and hence support for Labour. If Labour’s hope of a turnout surge among younger voters is borne out, these polls will no doubt be found wanting.
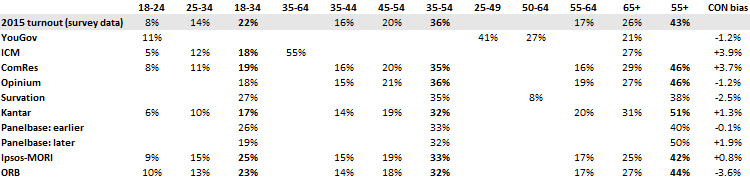
Indeed, various other methodological adjustments by these pollsters appear to be producing a turnout population that is somewhat older than that in 2015 (see table below). In the case of ICM, which is weighting by self-identified political interest levels, one recent poll was calculated by Wells as producing a Conservative lead eight points greater than would have been the case using the pollsters’ 2015 models.
Survation, which famously produced an accurate result on the eve of the 2015 election but shied away from publishing it, has not made any radical changes to its methodology, which continues to rely heavily on self-identification for turnout. Its age structure has varied considerably from poll to poll, but overall it has projected stronger turnout among the young than in 2015, and has accordingly produced strong results for Labour.
ORB appears to be splitting the difference between self-identification and turnout by age and education as recorded in 2015, and has produced the strongest results of all for Labour — albeit that this is heavily influenced by one outlier result in late April, when it recorded a Conservative lead of a mere 11%, as opposed to the trend measure of 19.6% at that time.
YouGov has received considerable attention for its strong results for Labour late in the campaign, but it has only been since mid-May that any such lean has been evident. This pollster has sought to redress the failings of 2015 by weighting by self-identified political interest level and education qualification, again with the aim of matching their results to post-election surveys. Its age model makes it hard to compare with other pollsters, since it uniquely breaks the middle groupings into 25-49 and 50-64 cohorts. However, its modelled turnout population looks more like the population at large than turnout in 2015.
Another big-name pollster, Ipsos MORI, has persisted with weighting by self-identified likelihood of voting, and accordingly has a young turnout model as compared with the 2015 election. However, this has not translated into particularly strong results for Labour, albeit that it has only published three results in the course of the campaign. The pollster has sought to address the industry-wide problem with over-representing the heavily engaged by weighting by education and newspaper readership, and using a range of indicators to exclude potential non-voters.
Opinium has been an odd man out in that its age breakdowns resemble those of ComRes, ICM and Kantar, but it has not produced correspondingly strong results for the Conservatives. Whereas the latter pollsters have purposefully weighted to a specific age model, Opinium appears to have achieved a similar effect through weighting to reported vote in 2015.
For further illumination on these matters, the following table shows how much weight each pollster has given to its various age cohorts, using averages of their polling over the campaign period. The final column is an averaged measure of how much the pollsters’ recorded Conservative leads have differed from the trend measure.
And finally, self-explanatory trend charts with the Conservatives shown as blue, Labour as red, Ukip as purple, the Liberal Democrats as gold, and the Scottish Nationalist Party as teal.
https://www.theguardian.com/politics/2017/jun/07/snp-anti-independence-nicola-sturgeon-angus-robertson#comments
The fiercely anti-SNP articles in the Manchester Guardian are always amusing to read. The comments by Scots are sometimes a hoot mon.
This buying off all the newspapers idea has come to my mind as well.
We should have last poll from ipsos at 8 30
Apparently this has happened and some cannot vote:
http://www.express.co.uk/news/uk/814084/Vote-General-Election-postal-ballots-Plymouth-City-Council
http://www.bbc.com/news/uk-england-devon-40184173
http://www.huffingtonpost.co.uk/entry/postal-votes-plymouth_uk_5936c81fe4b0cfcda917df42
Stephen Bush at New Statesman
A well argued, if also a pessimistic piece:
“Jeremy Corbyn will beat Ed Miliband in vote share, but will end up with fewer seats
My strong expectation from travelling the country and talking to campaigners is that Jeremy Corbyn will beat Ed Miliband’s vote share in 2015 and may even match Tony Blair’s in 2005. But I also think that these extra voters are insufficiently distributed thanks to first past the post, and that the party will lose significant numbers of seats.
This is great if politics is an argument in the pub. But the blunt truth is that Labour would swap Ed Miliband’s 31 per cent for Gordon Brown’s 28 per cent in a heartbeat, as that 28 per cent delivered 40 Scottish Labour MPs and a hung parliament.
It feels to me that once again, Labour will have gained voters while moving further away from office. ”
http://www.newstatesman.com/politics/june2017/2017/06/jeremy-corbyns-surge-labours-poll-boost-real
For those who those who want to follow each individual UK constituency (or seats) when the polls close, I’ve picked out a list of 10 marginal Tory-Labor constituencies to keep a close eye on to get some idea of what’s going to happen in the election:
BROXTOWE (East Midlands) – CON MARGIN: 8%
BLACKPOOL NORTH & CLEVELEYS (North West) – CON MARGIN: 8.5%
PUDSEY (Yorkshire and the Humber) – CON MARGIN: 8.8%
CALDER VALLEY (Yorkshire and the Humber) – CON MARGIN: 8.3%
BRISTOL NORTH WEST (South West) – CON MARGIN: 9.5%
COLNE VALLEY (Yorkshire and the Humber) – CON MARGIN: 9.5%
HASTINGS & RYE (South East) – CON MARGIN: 9.4%
HIGH PEAK (East Midlands) – CON MARGIN: 9.6%
STOCKTON SOUTH (North East) – CON MARGIN: 9.7%
HARROW EAST (Greater London) – 9.7%
Now, if my maths is correct, how the parties do in the these 10 seats would probably be indicative of how they are doing in the seat totals generally. Or to put it another way, here are some scenarios of what may go down:
In this case, the Conservative vote would be +7% above Labour nationally and they’ll be having a great night. May would have expanded her majority, and a Tory landslide would be on the cards.
In this case, the Conservative vote would be 4% to 6% above Labour nationally, which is where the poll average is more or less right now. Essentially, it would be a re-run of the 2015 General Election, with the Conservatives holding on to a small majority.
In this case, the Conservative vote would be 2% to 4% above Labour nationally. We’re entering hung Parliament territory (or close to it) and the Tory majority is under threat.
However, the Conservatives will be by far the largest party, and it is likely that they will fall short of only a few seats of a majority and need to rely on 1 small party to continue governing. (Most likely the British Ulster Dominion Party (DUP) or the Liberal Democrats.)
In this case, the Conservative vote would be tied to 2% above Labour nationally, and things start to get weak and chaotic. The Conservatives have lost their majority, and are probably more than +15 seats away from it.
They are still the largest party, but will probably have to work with a multitude of smaller parties that don’t trust each other, the SNP who certainly doesn’t trust the Tories, or call yet another snap election, ala UK 1974.
In this case, the Labour vote would be tied to 2% above the Conservatives nationally, and this is great news of them and absolutely terrible for the Conservatives. It would mean that the polls have drastically underestimated Labour and or/overestimated the Conservatives, and although the Tories are still the largest party, Labour might (and that’s a BIG might) have won enough seats (around 270) to form a coalition with the SNP (assuming the SNP has hold onto their seats and is up for it).
However, as crazy the idea of Corbyn becoming PM might’ve been 2 weeks ago; in this scenario, his Government would be very fragile – he would have won just enough seats to do so, which means any rebellion from his party or the SNP may stifle his agenda. (This principle also applies to the above scenarios where May returns with a smaller majority or a minority government.)
Let’s not beat around the bush here: in this case, Labour would be 2% to 4% above the Conservatives nationally at would a fantastic night for Corbyn and a disastrous one for May.
Not only would Labour be the largest party, but the polls would have to be way, way off course and would signal the end for many of the polling companies, especially the ones who’d given the Tories double digit leads.
This result would also make a mockery of UK and international pundits, centrist politicians and Tory election advisers whom said that Corbyn would be a disaster for the party; a boon for left-wing activists and populist politicians who would point to Corbyn’s victory as proof that left-wing parties no longer need to more centrist than right-wing parties in order to win elections; that young people are an integral base of support for winning elections, and the domination of older voters in elections may be coming to an end. Whether such conclusions were ultimately true, however, would remain to be seen.
Of course, it is worth pointing out that this last scenario is extremely unlikely to occur, and would require a massive polling error or oversight by the pollsters for this to even have a chance of occurring.
–/–/–/–/–/–/–/–/–/–/–/–/–/–/–/–/–/–/–/–/–/–/–/–/–/–/–/–/–/–/–/–/–/–
Of course, these are just my predictions which are subjective interpretations by me using some quick math and educated guesswork. I might be completely wrong about the informative power of these seats, and would be interesting to see if my guess in regards to the results match my predictions.
Anyway, make of this what you will, and apologies for the long post.
Has the Democratic Unionist Party changed its name to the British Ulster Dominion Party ???
swamprat @ #107 Thursday, June 8, 2017 at 8:01 pm
Typo, sorry. I meant the Democratic Unionist Party.
Nate Silver has a good piece as always. https://fivethirtyeight.com/features/the-three-scenarios-for-the-u-k-election
I do think it is most likely that the Conservatives will win a majority of seats. The fall in the UKIP vote will help them a lot. It looked as though there might be a last minute surge towards Labour because of the 20,000 cut in police numbers under May, but the latest YouGov did not show such a surge.
Still we don’t know. If there is a strong turnout by the young and a lower turnout by the old (because the older population think May has it in the bag), then the Conservatives could lose their majority. But everything will have to go right for Labour.
Just been down to vote, total time in the polling station .. 61 seconds, at least we can say we know how to organise the job
Re Millenials list of seats above, I don’t think any of those will have a quick declaration so you’ll be waiting a while
In the main thread Guytaur flagged up a statistician who’s done a full seat model, I’ve downloaded his spreadsheet and will compare the early returns (Sunderland etc.) to that to get a feel.
Frankly though, I expect the exit poll will nail it to within a dozen seats or so.
Google ‘Neil Marriott Election Forecast’ to see the spreadsheet mentioned above
https://www.theguardian.com/politics/live/2017/jun/08/general-election-2017-uk-polling-day-live
Interesting to see the tweets of people voting, especially those doing so for the first time or bringing their friends.. or their dogs.
If past elections are anything to go on we won’t have a clear idea of the result until between 1.00am and 3.00am uk time. It’s currently 6.30pm or so. We have several hours.
Some people are reportedly being turned away despite being registered and a UK citizen due to clerical errors.
I see Lord Ashcroft has published his final model, in 3 versions:
self reported turnout : C maj 96
2015 turnout: C maj 78
all who voted in Brexit referendum: C maj 52
The first two seem counter-intuitive to me but what do I know
So, the exit poll showed seats a bit better for the Tories than the Yougov, which was based on 4% Tory-Lab.
So assuming the exit poll shwoed ~5% difference, we would expect to see a 1.5% swing to Labour on the lead. (both are getting positive swings at the expense of UKIP).
But the average swing so far in 3 safe Labour seats has been 2.7% to the Tories.
Do we use this new data to revise the assumed voting % shares from the Exit poll, and assume that the Tory lead will be about 9%?
Or, was the exit poll correct in identifying the Nationwide voting figures, but the swing isn’t on in safe Labour seats. In which case, the vote lead might be 5%, but with seats more favorable to Labour than the exit poll if the swings are concentrated in the marginals?
Count faster!
And just as I post that, Labour cut 7% off the Tory lead in a seat hat they had a 22% lead in.
Voice
It seems as if the results are predictable to this extent:
1. Greens have decided that they can vote for Corbyn giving Labour an extra 2-3%
2. UKIP have gone 75% Tory and 25% Labour – predictable (so Tories are looking better in high UKIP seats)
3. LDP have probably swung to labour where they have no chance
So far that is all we know
Update
It seems that Corbyn is appealing in Scotland. This should have been predictable since to me Corbyn is exactly the sort of Labour guy to appeal to the craggy Scots.