One of the factors that was overlooked in the recent debate over Senate electoral reform was the hours of enjoyment election watchers used to have projecting Senate outcomes, with help from Antony Green’s calculators, thanks to the exquisitely predictable preferences flows that arose from the group voting ticket system. The fact that voters will now be largely making up their own minds means we are headed into unknown territory with the coming election. But that’s no reason to give up altogether, and I believe I’ve managed to come up with a reasonably stimulating projection exercise based on the following:
• Experience in the Australian Capital Territory tells us that voters overwhelmingly do what the ballot paper tells them to do, and no more than that, even if they are technically allowed to exploit savings provisions to number fewer boxes than indicated. On that basis, my model assumes every vote consists of six numbered boxes above-the-line.
• A ballot paper study from the 2010 Victorian state election tells us that how-to-vote cards are obeyed by 45% of Liberal voters, 41% of Labor voters and 25% of Greens voters, but by next to no micro-party voters as they lack the infrastructure to staff polling booths on a large scale. We don’t actually know what those how-to-vote cards will say at this stage (and I dare say controversies will emerge as some recalcitrants recommend a just-vote-one option), but the parties’ group voting tickets from 2013 are, at the very least, a useful starting point.
• For those who don’t follow the how-to-vote card, there is a very useful resource available in the form of the below-the-line voting data from the last election, which records the full preference order of every single voter who made up their own mind. I’ve used this to develop matrices indicating how many voters for each party included the various other parties in their top six. These are then mixed together with the how-to-vote card followers in the proportions indicated in the aforementioned Victorian election study (though only for Labor, Coalition, Greens, Australian Christians and Family First – for all other parties, I’m going entirely off the below-the-line data).
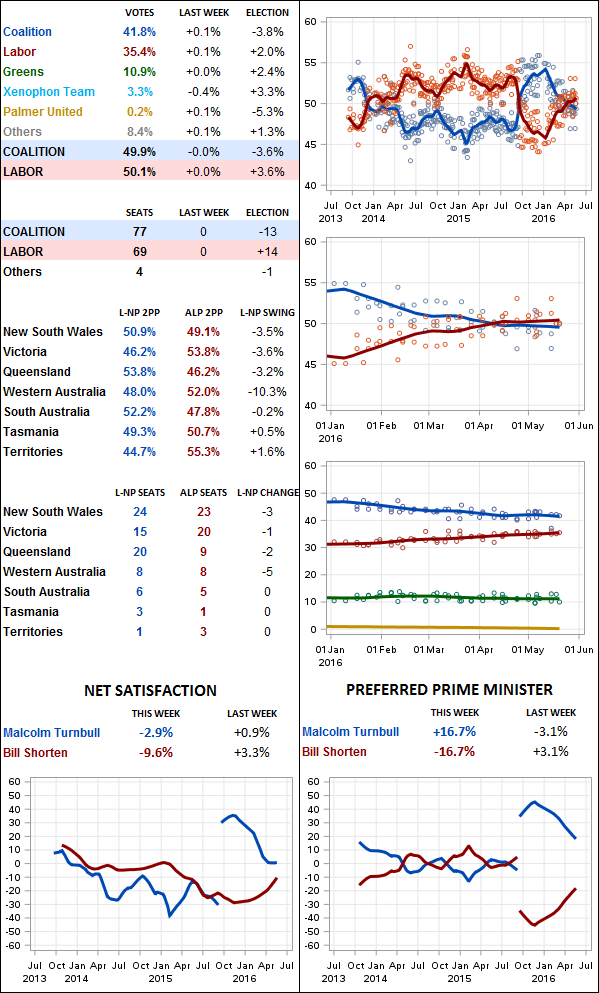
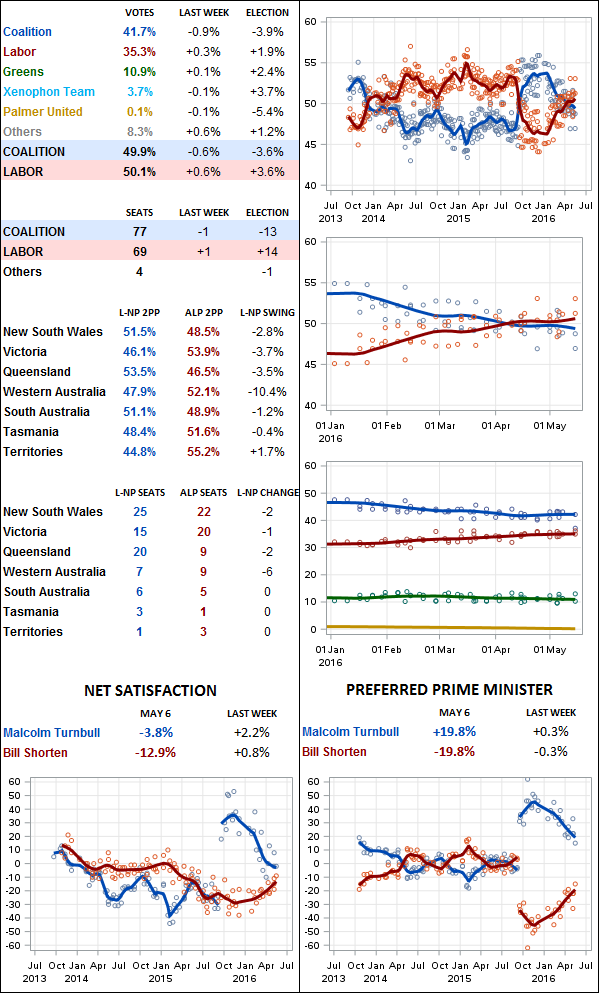
• The parties’ primary votes are, in the main, determined by applying the state-level swings currently recorded by BludgerTrack to the 2013 election result, with exceptions noted below. Whatever’s left over is distributed between the smaller parties in proportion to their share of the vote in 2013.
With those starting primary votes and assumptions about preference behaviour, it becomes possible to simulate an overall result. I must stress that I wouldn’t go betting the house on any of this, as a lot of the factors involved are tied to the last election result, and there is good cause to expect things will be different this time. The cast of minor parties is assumed to be the same as last time, and only in South Australia has the Nick Xenophon Team been accommodated. Nonetheless, this is a useful starting point for exploring how the Senate result might look, and will be refined over the rest of the campaign as more information becomes available. The results look a little something like this:
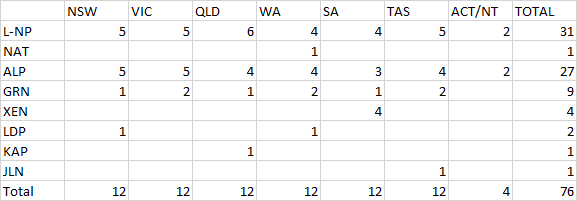
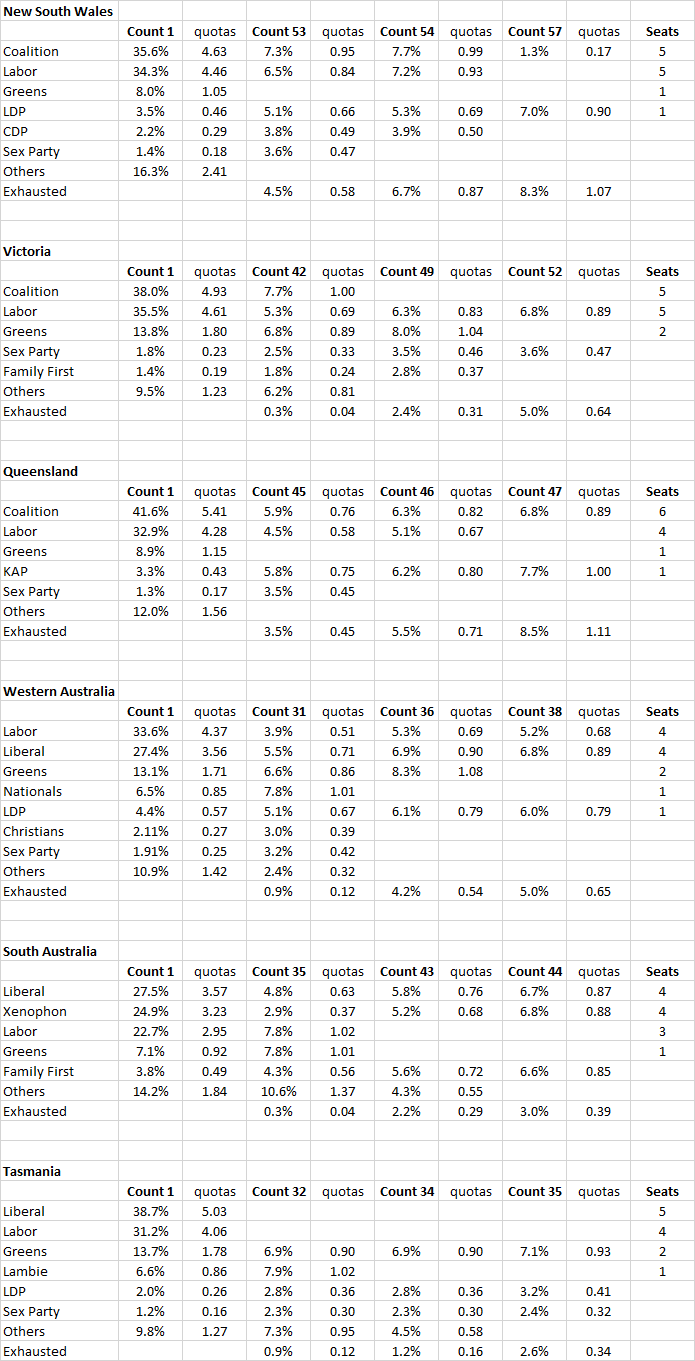
Now here’s the fine print, followed by a display showing key points in the projected counts:
NEW SOUTH WALES: I’ve arbitrarily clipped 6% off the Liberal Democrats and handed it over the Coalition, based on my guesstimate of how many of the party’s voters were confusing them with the Coalition when they drew first spot on the tablecloth ballot paper in 2013. That still leaves them 1.3% clear of the Christian Democrats as the fourth best polling party, which changes little through to Count 54, at which point the Australian Christians drop out and leave the last three positions to the three candidates remaining in the count: Coalition #5, Labor #5 and, taking the twelfth spot, David Leyonhjelm.
VICTORIA: The Sex Party survives to the final count, but lands around 3% short of Labor’s fifth candidate when it gets there. To cover that gap, it would need to improve on its 1.9% primary vote from 2013, and/or have Labor do a few points less well than the 35.5% projected for it. Family First makes it to the second last count, but the Coalition vote is strong enough on this accounting to ensure a monopoly on the five right-of-centre seats in Victoria.
QUEENSLAND: The projection has Coalition #5, Labor #4 and Katter’s Australian Party in a very close race for the last two seats, as indicated in Count 46, with Labor losing the game of musical chairs. However, Katter’s Australian Party ran a very high profile campaign in 2013 with a name candidate in country singer James Blundell, who was long thought a shoo-in before being elbowed aside by Clive Palmer and Glenn Lazarus. It’s hard to say if the party now stands to decline as a result of dwindling publicity, or clean up as voters desert Palmer United. Perhaps the more important lesson to be drawn from this is that the projection rates a base vote of 3.3% as a potential springboard for victory.
WESTERN AUSTRALIA: I’m dubious about the 10% swing against the Coalition in Western Australia recorded by BludgerTrack, and doubly so about Senate projections based on its results, since it reduces both major parties to the twenties. This inflates the minor and micro-party vote to cover the loss, which includes the Nationals and doesn’t include the Greens. For what it’s worth though, this results in a seat for the Liberal Democrats and also one for the Nationals, who may indeed by a show, but probably not with the level of certainty indicated by the model.
SOUTH AUSTRALIA: I haven’t made any adjustment at all to the 2013 election result, since the Nick Xenophon factor renders meaningless any comparison between the Senate result then and House swings now. The result effectively becomes a three-way tie for the past two seats between Liberal #4, NXT #4 and Family First, as indicated at count 44. The projection has Family First dropping out, but clearly it could have gone any which way.
TASMANIA: I’ve dealt with Jacqui Lambie by leaving her vote and preference structure from 2013 intact, which is possibly a little generous to her, but it will do for a start. That leaves her very close to a quota, and once she’s there, all that’s left is for the micro-parties to be weeded out until Greens #2 gains the final spot.