The first and best tranche of data from the 2021 census was released yesterday by the Australian Bureau of Statistics, prompting an article by me in Crikey yesterday in which I examined how the demographics of various electorates had changed over the past two five-year census cycles, with an inevitable focus on the teal independent seats (which have actually changed very little in demographic terms, some reporting and conservative rhetoric to the contrary) and other seats that turned against the Coalition. The latter tended to be notable for having few old people and, in many cases, large Chinese populations.
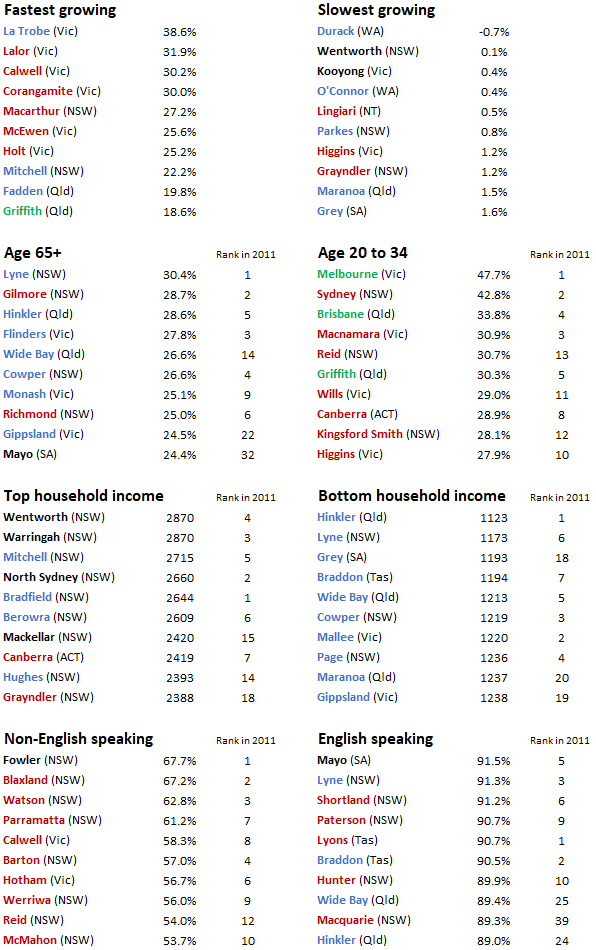
For the purposes of this exercise, I supplemented the new census data for federal electorates with comparable figures from the 2011 and 2016 census, aggregating finely granulated Statistical Area 1 results to produce numbers based on current boundaries. From this I further offer the tables below, the first two of which identify the fastest and slowest growing electorates in population terms over the past ten years. The majority of the former are on the outskirts of Melbourne and, in one case, Geelong — although as will be noted below, the underlying population boom this reflects has hit the skids since the onset of the pandemic. The latter include fully urbanised seats in the big cities and remote electorates that tend to be stagnant at the best of times, but have particularly come off since a resources development boom that peaked over a decade ago.
The tables in the Crikey article show which electorates have changed the most in terms of age, income and multiculturalism. Those below simply list those which rank highest and lowest on these measures, and where they placed on the rankings based on the 2011 data. It is notable that all ten of the bottom ranked seats by household income, as well all being in regional areas, are held by the Coalition – this was not the case ten years ago, when Lyons, Richmond and Gilmore featured. Labor’s near lock on the most multicultural seats, marred only by the loss of Fowler, has been assisted by the gain of Reid, which in turn was symptomatic of the swing against the Coalition among voters of Chinese heritage. Bennelong and Chisholm are placed twelfth and fourteenth on the list, and first and second for Chinese language speakers. The “growth” figures are as compared with the 2016 census.
Talk of federal electorates and population growth naturally leads on to the important question of how House of Representatives seats will be apportioned between the states and territories after the next election, which will be determined on the basis of the latest available population figures in the middle of next year. This is a little hard to call at the moment given growth hit a wall in the year after the onset of the pandemic, the impact of which fell so heavily on Victoria that its population actually fell by 1.5% over 2021, but a compensating recovery is now projected by people whose business it is to project such things. With that in mind, the following table shows how the determination would have looked based on population figures from the end of the past three years.
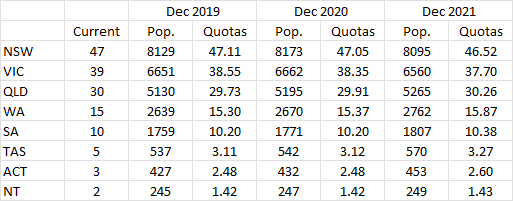
So steep has been the fall of Victoria’s share of the national population that it would appear to be headed for an unprecedented loss of two seats, although I would presume that with the return to normal conditions it will now bounce back and in fact lose only one. New South Wales is also presently teetering on the cusp of 46.5, below which it will lose a seat. By contrast, population growth in Queensland and Western Australia proceeded apace over the past three years, such that Western Australia looks like it will recover the sixteenth seat it lost last time — a fact that would once have boded ill for Labor, but seemingly no more — while Queensland would gain a thirty-first if its quota growth rate were maintained. It’s also not impossible that South Australia will arrest over three decades of declining representation to gain an eleventh seat. Constitutional limits and vagaries of the calculation formula ensure the status quo will be maintained in Tasmania and the Northern Territory.