The first and best tranche of data from the 2021 census was released yesterday by the Australian Bureau of Statistics, prompting an article by me in Crikey yesterday in which I examined how the demographics of various electorates had changed over the past two five-year census cycles, with an inevitable focus on the teal independent seats (which have actually changed very little in demographic terms, some reporting and conservative rhetoric to the contrary) and other seats that turned against the Coalition. The latter tended to be notable for having few old people and, in many cases, large Chinese populations.
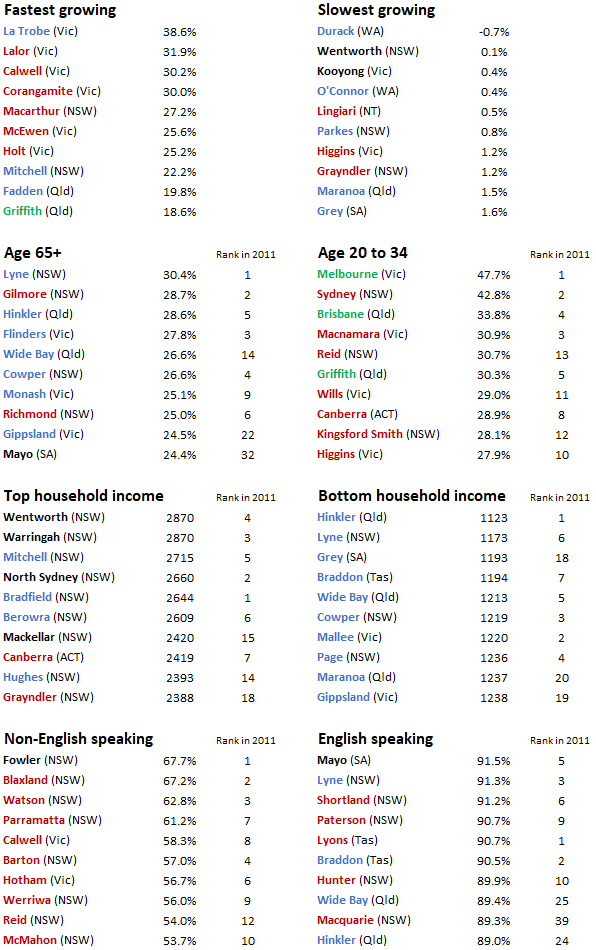
For the purposes of this exercise, I supplemented the new census data for federal electorates with comparable figures from the 2011 and 2016 census, aggregating finely granulated Statistical Area 1 results to produce numbers based on current boundaries. From this I further offer the tables below, the first two of which identify the fastest and slowest growing electorates in population terms over the past ten years. The majority of the former are on the outskirts of Melbourne and, in one case, Geelong — although as will be noted below, the underlying population boom this reflects has hit the skids since the onset of the pandemic. The latter include fully urbanised seats in the big cities and remote electorates that tend to be stagnant at the best of times, but have particularly come off since a resources development boom that peaked over a decade ago.
The tables in the Crikey article show which electorates have changed the most in terms of age, income and multiculturalism. Those below simply list those which rank highest and lowest on these measures, and where they placed on the rankings based on the 2011 data. It is notable that all ten of the bottom ranked seats by household income, as well all being in regional areas, are held by the Coalition – this was not the case ten years ago, when Lyons, Richmond and Gilmore featured. Labor’s near lock on the most multicultural seats, marred only by the loss of Fowler, has been assisted by the gain of Reid, which in turn was symptomatic of the swing against the Coalition among voters of Chinese heritage. Bennelong and Chisholm are placed twelfth and fourteenth on the list, and first and second for Chinese language speakers. The “growth” figures are as compared with the 2016 census.
Talk of federal electorates and population growth naturally leads on to the important question of how House of Representatives seats will be apportioned between the states and territories after the next election, which will be determined on the basis of the latest available population figures in the middle of next year. This is a little hard to call at the moment given growth hit a wall in the year after the onset of the pandemic, the impact of which fell so heavily on Victoria that its population actually fell by 1.5% over 2021, but a compensating recovery is now projected by people whose business it is to project such things. With that in mind, the following table shows how the determination would have looked based on population figures from the end of the past three years.
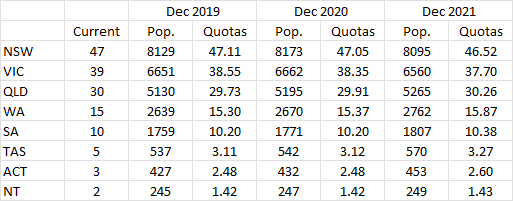
So steep has been the fall of Victoria’s share of the national population that it would appear to be headed for an unprecedented loss of two seats, although I would presume that with the return to normal conditions it will now bounce back and in fact lose only one. New South Wales is also presently teetering on the cusp of 46.5, below which it will lose a seat. By contrast, population growth in Queensland and Western Australia proceeded apace over the past three years, such that Western Australia looks like it will recover the sixteenth seat it lost last time — a fact that would once have boded ill for Labor, but seemingly no more — while Queensland would gain a thirty-first if its quota growth rate were maintained. It’s also not impossible that South Australia will arrest over three decades of declining representation to gain an eleventh seat. Constitutional limits and vagaries of the calculation formula ensure the status quo will be maintained in Tasmania and the Northern Territory.
Can we please keep this thread for discussion of the census, demographics, seat entitlements and such like. The open thread for general discussion is here.
From WB table based on Census, LNP holds all low income seats.
LNP does not hold a single seat where percentage of people of non-English speaking background is above 50%.
The poorest electorates – all coalition, all regional, and I’m assuming all the places that Sky ‘news’ broadcasts for free.
Is it not time to get rid of the nexus between the size of House of Representatives and the Senate. By amending section 24 of the Constitution we could return the Senate to 6 per state and enlarge the HoR to cater for the growing population.
A typo in your tables – Kooyong is in Vic not NSW
“KODsays:
Thursday, June 30, 2022 at 9:00 am
The poorest electorates – all coalition, all regional, and I’m assuming all the places that Sky ‘news’ broadcasts for free.”
right – ignorant flyover hicks. What would they know?.
Hillary Clinton, come on down.
KOD @ #3 Thursday, June 30th, 2022 – 9:00 am
And plenty of syndicated right-wing talkback on the radio!
I’d like to see the nexus go, but no change in the Senate numbers. That way the constitutional requirement for Tasmania to have five seats is not a problem. But then you get the issue if Tassie’s part of the population continues to decline, you get constantly more seats needing to be added.
On the 2021 numbers it would however result in NSW having 70 seats, Vic having 57, Qld having 45, WA having 23, SA having 16 and the ACT going to four seats. That’s a lot of MHRs (222). It would have been even more from 2019’s numbers – somewhere around 240 I’d think.
What could be done though in most states is use those additional seats to do some sort of MMP style top up.
“The poorest electorates – all coalition, all regional, and I’m assuming all the places that Sky ‘news’ broadcasts for free.”
But you missed the correalation that 5 of those seats also focus in the highest for over 65 and Page, Maranoa and Grey are most likely sitting just outside. These people who live in these seats rely on either the old age pension or their super as their incomes. Both Grey and Maranoa also have significantly higher indigenous populations than either their states or the nation.
It will be interesting to see where the population is at this time next year as I understand there will be redistributions initiated then if the seat entitlements change. Looks likely that WA will gain 1 seat and Victoria lose at least 1 seat. Possible that Queensland and maybe even SA gain a seat and NSW lose 1.
I had a look at the seats where 15%+ of the population report Chinese ancestry, I counted 14 in the country – 8 were in NSW (Bennelong, Bradfield, Reid, Banks, Barton, Sydney, North Sydney and Berowra) 4 were in VIC (Chisholm, Menzies, Kooyong and Melbourne) and 1 each in WA (Tangney) and QLD (Moreton). If you work out the average 2PP (ALP v LIB) across these seats there was a 7.21% swing to Labor, about double the nationwide average swing of 3.66%. This seems to support the view that the ethnically Chinese vote was particularly bad for the LNP at the last election.
Interesting observations mj.
The question I have is about a vic re-distribution, and menzies and deakin are kinda the ones that are ripe for it. These really are the places where the population has dropped. All I’m saying is that Vic might lose a seat in the new distribution, but there’s a good chance of it being a liberal seat that’s lost.
Pi I think with the Victorian Liberal vote already quite low chances are if Victoria loses 1 seat or 2 they lose just a little influence but the balance between the parties won’t significantly change, most likely a loss for the LNP overall if they lose a seat. If WA gain a seat the situation of the WA Liberal party suggests that would be a Labor gain.
The WA Liberals look moribund and therefore incapable I think that view is likely to spread more broadly across the country with time. The Liberals are a dogmatic party that are not moving with broader society and they are going to suffer for that.
”
mjsays:
Thursday, June 30, 2022 at 11:42 pm
I had a look at the seats where 15%+ of the population report Chinese ancestry, I counted 14 in the country – 8 were in NSW (Bennelong, Bradfield, Reid, Banks, Barton, Sydney, North Sydney and Berowra) 4 were in VIC (Chisholm, Menzies, Kooyong and Melbourne) and 1 each in WA (Tangney) and QLD (Moreton). If you work out the average 2PP (ALP v LIB) across these seats there was a 7.21% swing to Labor, about double the nationwide average swing of 3.66%. This seems to support the view that the ethnically Chinese vote was particularly bad for the LNP at the last election.
”
According to ABC breakfast show, NSW, VIC will lose 1 seat each as per latest census data.
Mattsays:
Thursday, June 30, 2022 at 5:28 pm
———————————–
When the matter went to a referendum in 1967 it was defeated due to it being seen as just attempt to increase the number of pollies. By reducing the senate that argument will be nullified.
Growth in the HoR is inevitable with growth in population. I agree that at some stage it may be better to consider alternatives rather than just allowing the house to grow. Multi member electorates is one possibility.
“KODsays:
Thursday, June 30, 2022 at 9:00 am
The poorest electorates – all coalition, all regional, and I’m assuming all the places that Sky ‘news’ broadcasts for free.”…
Those seats have voted for the Coalition even before SkyFakeNews, but only because Murdoch (and other conservatives before him) controlled the local newspapers. They are a clear example of what I call Voting Morons: People who vote against their own interests…. Poor, not well educated and voting for the Coalition, that makes sure to keep them poor and poorly educated…. Changing that situation is the real Revolution that must happen in Australia, in order to become a mature Democracy.
https://www.pollbludger.net/2022/06/30/coming-to-our-census/#comment-3946490
Being connected to shrinking the Senate would be poison at the referendum for any such amendment, for the same reason that the 1967 Parliament referendum did as badly as it did, namely that the DLP strongly opposed it because it would have made further enlargements of the number of senators per state far less likely (reducing the prospects of the DLP for seat winning) and reduced the ability of the Senators voting in a joint sitting to block legislation by diluting their proportion in the joint sitting.
With the growth of minor parties across the political spectrum and the introduction of Senate-style proportional legislative Councils in 4 states, anti-minor party measures such as removing the Nexus Clause would go down in flames harder than the 1967 Parliament Referendum.
Interesting question whether the redistribution that is due to commence in NSW in early 2023 (due to being seven years from the previous redistribution) will be deferred by a few months due to the possibility of a change in entitlement. The test in section 59(5)(c) is whether (in the AEC’s opinion), the determination “will or may” result in a change in entitlement.
Based on the seven year rule, the redistribution should commence within 30 days of 25 Feb 2023. That would mean that the AEC could theoretically wait for the Sept 2022 population data that will be released on 16 Mar 2023 before making up their mind on whether to defer or proceed. That Sept 2022 data set would be only one quarterly release away from the Dec 2022 data (due for release in June 2023) that will form the basis of the entitlement calculations to be conducted in July 2023.
But I think it’s more likely that the prospect of NSW losing a division fades sufficiently in the two releases between now and February, and the AEC just triggers the NSW redistribution at the earliest time, so that they can get it well underway ahead of those that will be triggered in July.
https://www.theage.com.au/national/victoria/from-lygon-street-to-springvale-how-the-faces-of-melbourne-s-suburbs-are-changing-20220630-p5axwu.html
Melbourne hasn’t stopped changing from what the census tells us. Pretty surprising insights there at least for me.
William, did you calculate growth rates for current electorates that had a major redistribution between 2011 and 2021? Some of the seats in the Hunter region have been growing pretty fast – I got a 13% growth in population between 2016 and 2021 in Paterson, but there was a big change in the boundaries between 2011 and 2016.
Given that Lyne, Hunter and Paterson have some of the highest enrolment figures in NSW, it would be interesting to see if the broader Hunter region gets back the extra seat that we had before the 2016 election (Charlton), though I guess this would be unlikely if NSW loses a seat in the national allocation.
I should have been clearer that the growth figures are as compared with the 2016 rather than the 2011 census – I’ve added a note on that now. I also get 13% growth in Paterson, so either the redistribution was already in effect at the 2016 census or the change didn’t make any difference. That places it at #33 on the rankings — pretty good, but no match for the outer capital city growth centres.