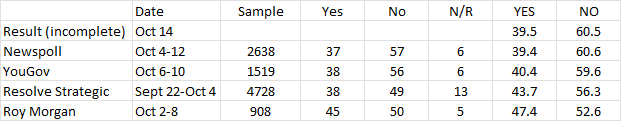
Click here for full display of Indigenous Voice referendum results.
Sunday morning
Below is the output of a linear regression model that uses four demographic variables (together with controls for state-level effects) to explain 87% of the variation in the yes vote by electorate, limited for technical reasons to the 141 seats of the five mainland seats.
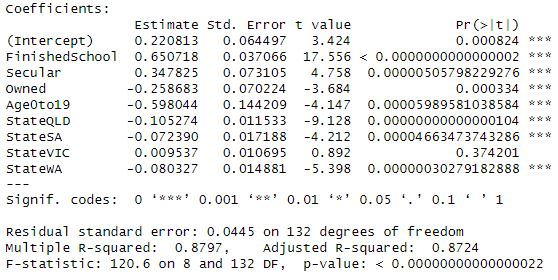
The choice of the four demographic variables was constrained by the need to pick ones that didn’t correlate over-much with each other. This tends to mean they could have been replaced with other variables they correlated with and still produced a robust result. To go through the four in turn:
Finished School, i.e. completed year 12. As you would expect, yes did very considerably better in seats with high educational attainment and occupational categories related with it. Such seats also tend to have high numbers of people in their twenties and thirties and renters, and few labourers.
Secular. Seats with a lot of people who identified as having no religious affiliation were significantly stronger for yes. This is a favourite variable of mine, because it reliably associates with support for post-materialist causes including a republic, same-sex marriage and the Indigenous Voice, and also with voting for Greens and teals.
Owned. Yes did worse in seats where a lot of people owned their homes, which in turn correlates strongly with the 60-plus age cohort, a measure of which might well have taken its place in the model.
Age0to19. Seats with a lot of children — or, looked at another way, mortgage-paying families — tended to do poorly for yes.
The four “state” variables tell us only that yes did better in the two bigger states than the three smaller ones, which we can tell more efficiently by looking at the results. In particular, they tell us that it did so over and above what might be expected from demographic variation between the states on the variables described above.
Saturday night
1.45am. Results updating again now, presumably with little if anything further to be added for the evening.
12.50am. There are still a few results outstanding in WA, but I’m going to have to turn off my results updating for a couple of hours. If you’ve found it in any way entertaining or useful — and it’s still the only place where you can find the results at booth level — please consider helping out with a contribution through the “become a supporter” button at the top of the site.
11.55pm. Most of the Mobile Remote Team results are in from Lingiari now, and the yes vote among them has come back to 71.6%.
10.39pm. My live results stalled for a bit there because I was hacking around trying to get Remote Mobile Team results to appear in Lingiari, which they are now doing. These are of interest because they serve largely, though not exclusively, remote Indigenous communities. With six out of 22 reporting, the results are 2908 yes (79.7%) and 742 no (20.3%).
9.34pm. Looking increasingly certain now that Victoria will also be a no. Early numbers in Western Australia confirm what you would expect there too.
8.35pm. The prospect of a yes majority in Victoria has been drifting away, with my projection of 51.7% no getting steadily closer to the raw result of 52.2%. These numbers are probably flattering yes, because postal votes in particularly are likely to be very conservative.
8.07pm. First numbers from Northern Territory are about 70-30 to no, but this could be a bit of a rollercoaster due to the peculiarity of heavily indigenous remote mobile booths — no insight I can offer on when those might report.
7.58pm. Malarndirri McCarthy on the ABC going through results from heavily indigenous booths in Queensland, which are as high as 75%. You can see the relevant booths on my pages for Leichhardt and Herbert — click activate at the bottom of the links to see the map display, and the ones with green (i.e. yes) numbers are pretty much the ones McCarthy was going through.
7.55pm. If the potential for voting to happen after the result is confirmed be deemed an issue, WA is getting a bad case of it, thanks to daylight saving and decisive results on the eastern seaboard.
7.53pm. My system has come through with the formality of calling Queensland for no, joining New South Wales, South Australia, Tasmania and the national result. The ACT is called for yes, and I have a 68% probability for no in Victoria. Nothing yet from the Northern Territory, where polls closed 23 minutes ago, or Western Australia where they do not close for over an hour.
7.31pm. My system has also been calling the national vote for no for some time, and clearly won’t be long in calling Queensland for no. Victoria remains very close, with yes having consistently been projected to be a shade below 50%.
7.24pm. Got that out a matter of seconds before Antony Green said the same.
7.23pm. My system is calling South Australia for no.
7.18pm. First results emerging from Queensland, inevitably going very heavily to no from small rural booths.
7.17pm. Behind Antony Green’s eight-ball here, but my system is now calling NSW for no.
7.07pm. I’m projecting a tight result in Victoria — raw yes vote is 47.5%, but my adjustment to account for where the votes are from gets it to 49.2%.
7.03pm. ABC calling New South Wales for no, though my system isn’t quite there yet.
6.59pm. And for what very little it’s worth, my system is calling the ACT for yes.
6.57pm. My system is calling Tasmania for no, and so apparently is Antony Green’s.
6.52pm. Among many other dubious things, the no campaign succeeded in propagating several news reports to the effect that teal seats were going to do badly for yes. But so far, yes ranges from 58% in Mackellar to 73% in Kooyong.
6.48pm. I’m calculating probabilities in a way I’m not confident enough about to include in the results pages, but they’re getting very close to calling Tasmania for no and ACT for yes — although Tasmania could potentially swing back as more Hobart booths report.
6.45pm. First booth in from South Australia — Darke Peake in Grey — records 55 votes for no and three for yes.
6.40pm. If you’re finding the results feature of any use or interest, you may perhaps care to make a contribution through the “become a supporter” buttons you’ll find at the top of this page or on the results page itself.
6.38pm. My projection for yes has improved in Victoria, from around 43% to 46.6%. But thumping no leads elsewhere.
6.27pm. So far I’m projecting very similar results in New South Wales, Victoria and Tasmania — the three states where voting has closed — ranging from 56.6% to 57.7%. Yes well ahead from a tiny count in the ACT.
6.21pm. With only yes and no to count, rather than multiple candidates never mind two-candidate preferred, the count is clearly going to progress very quickly. So far, there are seven booths with yes majorities and 44 with no.
6.20pm. The very earliest results are presumably from the most rural of areas, whereas my projection works off seat results. So if the booth results so far are conservative even by the standards of the seats they are in, as I suspect to be the case, the early projections should be unflattering for yes.
6.15pm. Small booths in from Farrer and Parkes in NSW and Wannon in Victoria, and my results seem to be working.
6pm. Polls have closed in eastern states with daylight saving. My results feature consists of a front page summarising results at national, state/territory and seat level, and results pages at House of Representatives seat level which include booth results in both table and map form (for the latter, click the activate button at the bottom of the relevant page). The seat results pages can be accessed from the drop-down menu or the “results by electorate” section at the bottom end of the main page.
The “projected” results for the national and state/territory votes make use of the seat-level estimates from Focaldata’s multi-level regression with post-stratification exercise as a baseline for measuring such results as are reported. However much they differ from Focaldata’s estimates of the relevant seats is projected on to Focaldata’s aggregated estimates. Doubtless this will be noisier than the booth-matched swings methods that can be applied at elections, but it should at least go some way towards correcting for the peculiarities of the early numbers.