Supercalifragilecologicallyfallacious

Ground zero in the swing against Labor: areas rich in religious, low-income workers in the construction, manufacturing and retail industries, preferably in Queensland or Tasmania.

Ben Phillips of the Australian National University has been hawking research showing the demographic indicators that associated most clearly with the federal election swing, with the clearest patterns relating to Christianity, which correlated with a swing against Labor, and education and income, which went the other way. Evidently the Australia Institute has done something similar, with findings reported by Ross Gittins in the Sydney Morning Herald.

In considering research of this kind, one must acknowledge the perils of the ecological fallacy, whereby inferences about the behaviour of individuals are inappropriately drawn from aggregate-level data. My favourite illustration of this point relates to American politics, wherein the Republicans’ strongest states are those of the dirt-poor deep south, whereas wealthier voters favour the more conservative party in the United States as surely as they do here. As such, it should be recognised that Christian areas swinging to the Coalition need not signify that Christian voters did.

Nonetheless, the relationship between swings and the demographic features of the areas in which they did or didn’t happen is interesting in and of itself, and really all we have to go on until the Australian National University eventually publishes its Australian Election Study survey, particularly in the absence of intensive and high-quality exit polling that is conducted in the United States.

My own number crunching along these lines has involved collecting demographic measures of the areas in which each polling booth is located, and using multiple regression analysis to determine how well they predicted the primary vote swing to or against Labor. The results were as interesting for what didn’t prove predictive as for what did. In particular, an electorate’s age profile appeared to have little impact on its swing – or at least, none that couldn’t be better explained by other variables that might themselves correlate with age. This theme was picked up on in the article linked to above by Ross Gittins, which argues against the widely held notion that franking credits was the main culprit behind Labor’s poor show.

After a bit of trial and error, and whittling it down to variables that didn’t appear to be separately measuring identical effects, the most instructive variables proved to be income, home ownership, education and industry of employment, with a few ethnicity measures registering as worth-including-but-only-just.

Continue reading “Supercalifragilecologicallyfallacious”

Seat du jour: Gilmore

A look at the complicated contest for the south coast New South Wales seat of Gilmore, where high-profile Liberal recruit Warren Mundine has his work cut out defending one of the Coalition’s narrowest margins.

To crank up the action a little ahead of the big occasion, there will henceforth be daily posts profiling key seats, and accompanying threads for discussing them. Today we visit the south coast New South Wales seat of Gilmore (full election guide entry here), where the Liberals are defending a 0.7% margin in the absence of retiring incumbent Ann Sudmalis, the member since 2013. This has developed into a complicated contest between high-profile Liberal candidate Warren Mundine; an independent, Grant Schultz, who was elbowed aside as Liberal candidate to make way for Mundine; a well-credentialled Nationals candidate in former state government minister Katrina Hodgkinson; and the Labor candidate, Fiona Phillips. In a snub to Mundine, Hodgkinson has received endorsements from both Ann Sudmalis and her predecessor, Joanna Gash.

Gilmore was created in 1984 and held for its first decade by the Nationals, before a redistribution exchanged interior territory for Kiama in the southern Illawarra, strengthening Labor and causing the Liberals to supplant the Nationals as the competitive Coalition party. Peter Knott gained the seat for Labor in 1993, then fell with the Keating government’s defeat in 1996, when Joanna Gash picked up a decisive swing of 6.7%. Gash established a strong electoral record in retaining the seat through to her retirement in 2013, her best win coming with a 10.1% swing when Peter Knott attempted a comeback in 2001. This may have been influenced by Knott’s assertion during the campaign that the recent September 11 attacks had been a case of American foreign policy “coming back to bite them”.

Gash’s successor, Ann Sudmalis, had an unspectacular electoral debut in 2013, suffering a 2.7% swing despite the heavy defeat of the Labor government. She was then saved at the 2016 election by a 1.3% redistribution adjustment, which was followed by a 3.0% swing that brought the margin inside 1%. Recent reports suggest the Liberals are not optimistic – in an account of a potential pathway to victory being plotted by party strategists, Saturday’s Financial Review listed Gilmore among four seats rated almost beyond salvaging, and thus in need of balancing with gains from Labor elsewhere. Another recent report in The Age said Labor’s internal polling had them ahead, by an unspecified margin.

Newspoll: 51-49 to Labor

Newspoll caps a weekend of status quo by-election results with a status quo poll result.

I’d have thought Newspoll might have had the week off, but The Australian reports that the latest instalment has Labor maintaining its 51-49 lead, with the Coalition up a point on the primary vote to 39%, Labor steady on 36%, the Greens steady on 10% and One Nation steady on 7%. On personal ratings, Malcolm Turnbull is up one on approval to 42% and down one on disapproval to 48%, Bill Shoten is steady on 32% and up one to 57%, and Turnbull’s lead as preferred prime minister is unchanged at 48-29. The poll was conducted Thursday to Sunday from a sample of 1704.

Newspoll: 51-49 to Labor

A fortnight on from the Malcolm Turnbull’s unfortunate Newspoll milestone, Newspoll itself suggests the embarrassment has done him little harm.

The latest Newspoll has Labor’s lead down from 53-47 to 51-49, which is the Coalition’s best result since the start of what is now Malcolm Turnbull’s run of 31 successive Newspoll defeats. This doesn’t reflect much activity on the primary vote, on which the Coalition and Labor are both steady at 38% and 37%, with the Greens down one to 9% and One Nation steady on 7%.

There is also encouragement for Malcolm Turnbull on leadership ratings, with his approval up four to 36% and disapproval down four to 53%, although Bill Shorten also improves by two on approval to 34% and three on disapproval to 53%. Turnbull maintains only a very modest lead as preferred prime minister, of 38-35, out from 38-36 last time. The poll also finds strong support for a reduction in immigration levels, with 56% rating the present level too high, 28% about right, and only 10% too low.

A point that should be noted about the Coalition’s apparent improvement in Newspoll is that at least part of it would seem to be down to an adjustment in their preference allocations, from a model based purely on results from the 2016 election to one which gives the Coalition a stronger flow of One Nation preferences, presumably based on the experience of the Queensland and Western Australian state elections. The chart below compares the published two-party results from Newspoll with how the raw primary numbers convert using a) a 50-50 split in One Nation preferences, as they were in 2016; and b) a 60-40 split in the Coalition’s favour, which seems more likely based on state election experience.

It will be noted that Newspoll (the grey line) closely tracked the 50-50 model (the blue line) until December last year, when it snapped to the 60-40 model (the orange line). Also noteworthy is the overshoot of the grey line for the very latest result, which reflects the fact that the Coalition may have been a little lucky with rounding this week. As Kevin Bonham notes, a calculation from the published, rounded primary vote totals using the 50-50 preferences model yields a 52.4-47.6 lead for Labor – a result that would have generated considerably less buzz than this, the “best Coalition result in 18 months”.

BludgerTrack: 52.3-47.7 to Labor

A look under the hood of a rewired BludgerTrack.

BludgerTrack returns for 2018 with methodological tinkering to address two issues. The first is an effort to account for a different preference environment with the rise of the One Nation; the second puts the various pollsters on a level playing field in calculating the leadership rating treds.

After polling a national primary vote of 1.3% from the fifteen lower house seats they contested, One Nation’s polling has been approaching double figures for at least the past year. This limits the utility of allocating preferences as they flowed at the previous election, which is the most reliable method when the minor party environment experiences little change from one election to the next. The Coalition received barely more than half of One Nation’s preferences in 2016, but they did quite a bit better than that at last year’s state elections, receiving around 65% in Queensland and 60% in Western Australia — presumably because many of their new supporters have defected from the Coalition.

The alternative to previous election preference flows is respondent allocation, which the experience of the state elections suggests is leaning too far in the other direction. The approach now taken by BludgerTrack is to split the difference, which would have worked well if it had been applied in 2016. This is done by combining trend measures of previous election and respondent-allocated flows, with Ipsos and ReachTEL providing the data for the latter.

Continue reading “BludgerTrack: 52.3-47.7 to Labor”

Senate of the day: New South Wales

An in-depth review of the Senate election situation in the Premier State.

it

I’m not sure if I’ll get through them all in time, but the plan here is to run a series of posts for all six states probing into the Senate contest, starting with the big one. The political and historical background to the contest is featured on a separate federal election guide entry – here I propose to consider the possible result, by building on the work featured in this earlier post.

The first question that needs to be address is how much of the vote should be attributed to what I shall refer to here as the “non-establishment parties”, i.e. everyone other than the Coalition, Labor and the Greens. In 2013, the non-establishment parties got 26.4% of the vote between them, but it is generally reckoned that about 6% of this came from Liberal supporters who were bamboozled by the Liberal Democrats’ position at the top of the ballot paper. However, BludgerTrack suggests the ”others” vote in New South Wales is now nearly 8% higher than in 2013, suggesting the non-establishment vote share will again be north of 25%. My simulations suggest that it would need to fall to about 20% for the micro-parties lose out entirely in a double dissolution context, and that a second seat becomes possible under some scenarios if it’s well clear of 25%. For any individual micro-party, a winning result could well be as low as 2.5%. The only non-establishment parties at this level in 2013 were the Liberal Democrats with their one-off of 9.5%, and Palmer United on 3.4%, much of which will presumably now scatter among assorted micro-parties.

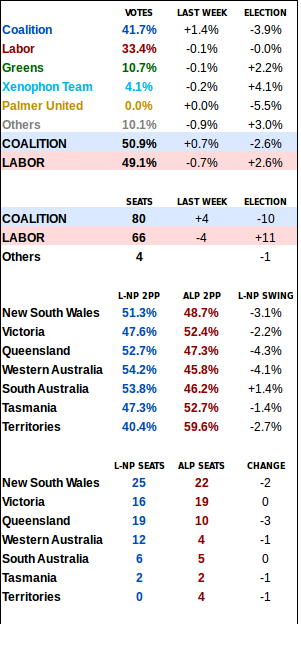
David Leyonhjelm would seem to have a strong chance of being re-elected, since the Liberal Democrats managed 2.3% when it had last place on the ballot paper in 2010, and had now enjoyed three years of publicity attendant to Leyonhjelm’s spell in the Senate. This time the Liberal Democrats are in second position, although the advantage is mitigated somewhat by the fact that the Coalition isn’t far away at number four (party logos will also work to reduce confusion, if they do their job). Both major parties have directed a preference to the party on their how-to-vote cards, which could be handy provided one or both gets excluded from the count. Others with the potential to poll in the required range are the Christian Democratic Party, who have landed a bit below 2% in recent times; Shooters, Fishers and Farmers, who managed 2.3% before falling to 1.3% amid a more crowded field in 2013; and the unknown quantity that is the Nick Xenophon Team. As for the establishment parties, the Coalition would be doing particularly poorly to fall to four seats, whereas Labor seems unlikely to make it to five (unless no micro-parties are elected, in which case the Coalition might also make it to six). Certain scenarios turn up a second seat for the Greens, but one seat seems more likely.

I’ll now turn to a simulation based on the best information available to me at present, together with a few hopefully lucky guesses. First, I have derived a hypothetical set of vote shares, starting from the assumption that the BludgerTrack swing figures – Coalition down 5.8%, Labor up 0.6%, the Greens up 1.6% and others up 7.8% – can be applied to the 2013 Senate results. Then I hand 6% from the Liberal Democrats to the Coalition to correct for the 2013 anomaly; set the Nick Xenophon Team at 2.5%, based on an average of their state-level polling this month; and set Palmer United at 0.5%, since obviously its vote this time will not in any way be proportionate to last time. That leaves 21.0% of the vote to be distributed between 35 micro-parties, including 22 that contested in 2013 and 13 that didn’t. The former get the same share of the micro-party vote they got in 2013, causing their vote shares to increase by about 25%. The new parties get a randomly determined share of the 2.9% of the vote received in 2013 by the 14 parties who contested then but aren’t now.

The method of allocating preferences is as it was during my previous venture into this field – through a combination of below-the-line voting data from 2013, and assumptions that 45% of Coalition, 41% of Labor and 25% of Greens voters will follow the how-to-vote card. Nick Xenophon Team preferences are based, as much as possible, on Xenophon’s preferences flows in South Australia in 2013. Preferences to the NXT are trickier – the best I could think to do is again go off the flow of preferences to Xenophon in South Australia in 2013, which was very high indeed, and reduce them by the arbitrary amount of three-quarters. The how-to-vote cards for the relevant parties run as follows, as far as I’m aware (the Greens in at least one state have left some discretion to their local branches):

COALITION: 2. Christian Democratic; 3. Shooters, Fishers and Farmers; 4. Family First; 5. Liberal Democrats; 6. Australian Motoring Enthusiasts Party.
LABOR: 2. Greens; 3. Renewable Energy Party; 4. Animal Justice Party; 5. Australian Sex Party; 6. Liberal Democrats.
GREENS: 2. Pirate Party; 3. Science/Cyclists; 4. Socialist Alliance; 5. Animal Justice; 6. Labor.

2016-06-24-senate-projected-nsw

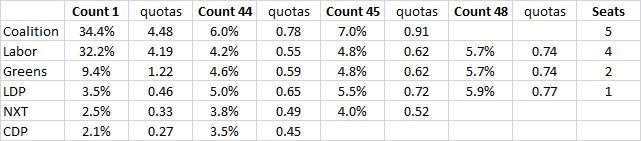
After running that through the machine, the result that spits out is Coalition five, Labor four, Greens two and Liberal Democrats one. If nothing else, the result offers some hints as to why the Greens were so keen on electoral reform: under the old system, their second candidate would hardly have budged during the count from their starting surplus of 0.22, and they certainly wouldn’t have been in contention at the end. I mentioned before that most speculative scenarios I ran weren’t giving the Greens a second seat, but they have managed it here by the skin of their teeth. As is illustrated at Count 48, the last two seats emerge as a three-horse race between the Liberal Democrats, Greens #2 and Labor #5, in which the latter just loses out.

Seat du jour: New England

One of the most interesting sideshows of the coming electorate is the rural New South Wales seat of New England, where the Deputy Prime Minister is under threat from a former independent.

New England is a naturally safe conservative seat in north-eastern New South Wales that nonetheless looms as one of the most interesting contests of the election, as Nationals leader Barnaby Joyce takes on the seat’s former independent member of 12 years, Tony Windsor. The electorate lies to the interior of the coastal electorates of Page, Cowper and Lyne, covering a 400 kilometre stretch of rural territory from north to south that encompasses the population centres of Armidale, Tamworth, Inverell and Glen Innes. It has existed since federation and changed remarkably little over that time, at all times accommodating Armidale and Tamworth and losing Glen Innes only between 1934 and 1949. The latest redistribution has transferred the Shire of Gunnedah and its 8700 voters to Parkes in the west, while adding the Shire of Hunter to the southern end of the electorate, home to 9500 voters formerly in Hunter, and a thinly populated area in the southern half of the Shire of Gwydir, adding 2000 voters from Parkes.

Barnaby Joyce was first elected to parliament as a Senator for Queensland in 2004, and quickly became the Nationals’ most visible figure. Despite a penchant for crossing the floor, he became leader of the Nationals in the Senate in September 2008, and served in a range of portfolios in the shadow ministry from December 2012 until the September 2013 election victory. Joyce had been open in his desire to move to the lower house, but his designs on the rural Queensland seat of Maranoa were thwarted by the determination of the sitting member, Bruce Scott, to seek another term at the 2013 election. His second favoured option was across the state border in New England, as he was born in Tamworth, raised in Woolbrook and moved back in forth in his adult life between the electorate and Queensland. However, the seat was at that time held by Tony Windsor, and the party’s favoured plan for recovering it was to enlist the services of Richard Torbay, who had held the Armidale-based seat of Northern Tablelands in the state parliament since 1999. Torbay agreed to do so in mid-2012, when the party granted him “freedom to speak with an independent voice on local issues”.

Torbay’s ambitions became rapidly unstuck in March 2013 when the Financial Review reported he had received assistance from embattled Labor operative Eddie Obeid ahead of his run for state parliament in 1999. Over the next two days Torbay withdrew as candidate and resigned as member for Northern Tablelands, and his home was raised the following week by the Independent Commission Against Corruption. Joyce was quick to reiterate his interest in the seat, despite a degree of disquiet towards him in the local party that had earlier seen his opponents sound out the party’s state leader, Andrew Stoner, with a view to running against Windsor and assuming the federal party leadership in Joyce’s stead. In the event, Joyce did not face serious opposition in the local preselection, and went on to serve as Agriculture Minister with the election of the Abbott government, further gain the water resources portfolio in September 2015, and finally became Nationals leader and Deputy Prime Minister after Warren Truss stepped aside in February 2016, having been elected unopposed.

A new cloud appeared on Joyce’s horizon in March 2016, when Tony Windsor announced he would seek to recover the seat he had relinquished at the 2013 election. Windsor came to politics from a background as a local farmer and economist, winning the state seat of Tamworth as an independent in 1991 after unsuccessfully seeking preselection to succeed a retiring Nationals member. Windsor benefited from a revolt of local party members after receiving the support of seven out of nine local party branches, and he went on to defeat the Nationals candidate by 9.8% after preferences, and effortlessly win re-election in 1995 and 1999. Windsor’s first victory gave him an early taste of life as an independent in a hung parliament, Nick Greiner’s Coalition government having lost its majority at the election. Windsor was at first the most accommodating of the independents in shoring up Greiner’s position in parliament, but he would join the others in forcing Greiner’s resignation following an adverse ICAC finding in June 1992.

Windsor announced his intention to contest New England two months out from the 2001 federal election, and duly prevailed by an 8.3% margin over Nationals incumbent Stuart St Clair. His testy relationship with the Nationals worsened in the lead-up to the 2004 election when he claimed he had been offered a sinecure if he agreed to quit politics, telling parliament a few months later that the offer was communicated to him by a Tamworth businessman acting at the behest of John Anderson and Nationals Senator Sandy Macdonald. This was denied by all concerned, including the businessman. Household name status awaited Windsor after the 2010 election left him and four other cross-benchers holding the parliamentary balance of power, and he together with the other New South Wales regional independent, Lyne MP Rob Oakeshott, threw their lot in with Labor, despite the conservative complexion of their electorates. All subsequent indications were that both Windsor and Oakeshott had paid a high political price for their decision, with polls suggesting he was headed for defeat. On the day that Julia Gillard was deposed as Labor leader in June 2013, both Windsor and Oakeshott announced they would not seek re-election, with Windsor invoking health concerns.

Windsor returned to the spotlight in July 2015 when he campaigned against the government’s decision to approve the $1.2 billion Shenhua Watermark coal mine near Gunnedah, which Joyce himself had characterised as “mad”. His announcement that he would run against Joyce came shortly after a ReachTEL opinion poll found he would attract 32.2% of the primary vote compared with 39.5% for Joyce, suggesting Joyce would be at serious risk of losing the seat after distribution of Labor and Greens preferences.