I’m not sure if I’ll get through them all in time, but the plan here is to run a series of posts for all six states probing into the Senate contest, starting with the big one. The political and historical background to the contest is featured on a separate federal election guide entry – here I propose to consider the possible result, by building on the work featured in this earlier post.
The first question that needs to be address is how much of the vote should be attributed to what I shall refer to here as the “non-establishment parties”, i.e. everyone other than the Coalition, Labor and the Greens. In 2013, the non-establishment parties got 26.4% of the vote between them, but it is generally reckoned that about 6% of this came from Liberal supporters who were bamboozled by the Liberal Democrats’ position at the top of the ballot paper. However, BludgerTrack suggests the ”others” vote in New South Wales is now nearly 8% higher than in 2013, suggesting the non-establishment vote share will again be north of 25%. My simulations suggest that it would need to fall to about 20% for the micro-parties lose out entirely in a double dissolution context, and that a second seat becomes possible under some scenarios if it’s well clear of 25%. For any individual micro-party, a winning result could well be as low as 2.5%. The only non-establishment parties at this level in 2013 were the Liberal Democrats with their one-off of 9.5%, and Palmer United on 3.4%, much of which will presumably now scatter among assorted micro-parties.
David Leyonhjelm would seem to have a strong chance of being re-elected, since the Liberal Democrats managed 2.3% when it had last place on the ballot paper in 2010, and had now enjoyed three years of publicity attendant to Leyonhjelm’s spell in the Senate. This time the Liberal Democrats are in second position, although the advantage is mitigated somewhat by the fact that the Coalition isn’t far away at number four (party logos will also work to reduce confusion, if they do their job). Both major parties have directed a preference to the party on their how-to-vote cards, which could be handy provided one or both gets excluded from the count. Others with the potential to poll in the required range are the Christian Democratic Party, who have landed a bit below 2% in recent times; Shooters, Fishers and Farmers, who managed 2.3% before falling to 1.3% amid a more crowded field in 2013; and the unknown quantity that is the Nick Xenophon Team. As for the establishment parties, the Coalition would be doing particularly poorly to fall to four seats, whereas Labor seems unlikely to make it to five (unless no micro-parties are elected, in which case the Coalition might also make it to six). Certain scenarios turn up a second seat for the Greens, but one seat seems more likely.
I’ll now turn to a simulation based on the best information available to me at present, together with a few hopefully lucky guesses. First, I have derived a hypothetical set of vote shares, starting from the assumption that the BludgerTrack swing figures – Coalition down 5.8%, Labor up 0.6%, the Greens up 1.6% and others up 7.8% – can be applied to the 2013 Senate results. Then I hand 6% from the Liberal Democrats to the Coalition to correct for the 2013 anomaly; set the Nick Xenophon Team at 2.5%, based on an average of their state-level polling this month; and set Palmer United at 0.5%, since obviously its vote this time will not in any way be proportionate to last time. That leaves 21.0% of the vote to be distributed between 35 micro-parties, including 22 that contested in 2013 and 13 that didn’t. The former get the same share of the micro-party vote they got in 2013, causing their vote shares to increase by about 25%. The new parties get a randomly determined share of the 2.9% of the vote received in 2013 by the 14 parties who contested then but aren’t now.
The method of allocating preferences is as it was during my previous venture into this field – through a combination of below-the-line voting data from 2013, and assumptions that 45% of Coalition, 41% of Labor and 25% of Greens voters will follow the how-to-vote card. Nick Xenophon Team preferences are based, as much as possible, on Xenophon’s preferences flows in South Australia in 2013. Preferences to the NXT are trickier – the best I could think to do is again go off the flow of preferences to Xenophon in South Australia in 2013, which was very high indeed, and reduce them by the arbitrary amount of three-quarters. The how-to-vote cards for the relevant parties run as follows, as far as I’m aware (the Greens in at least one state have left some discretion to their local branches):
COALITION: 2. Christian Democratic; 3. Shooters, Fishers and Farmers; 4. Family First; 5. Liberal Democrats; 6. Australian Motoring Enthusiasts Party.
LABOR: 2. Greens; 3. Renewable Energy Party; 4. Animal Justice Party; 5. Australian Sex Party; 6. Liberal Democrats.
GREENS: 2. Pirate Party; 3. Science/Cyclists; 4. Socialist Alliance; 5. Animal Justice; 6. Labor.
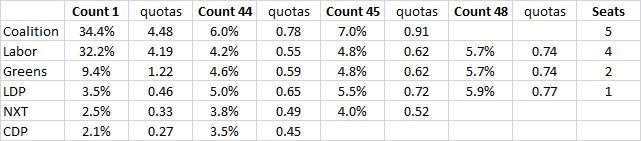
After running that through the machine, the result that spits out is Coalition five, Labor four, Greens two and Liberal Democrats one. If nothing else, the result offers some hints as to why the Greens were so keen on electoral reform: under the old system, their second candidate would hardly have budged during the count from their starting surplus of 0.22, and they certainly wouldn’t have been in contention at the end. I mentioned before that most speculative scenarios I ran weren’t giving the Greens a second seat, but they have managed it here by the skin of their teeth. As is illustrated at Count 48, the last two seats emerge as a three-horse race between the Liberal Democrats, Greens #2 and Labor #5, in which the latter just loses out.
Can we please reserve this thread for Senate discussion – the post prior to this one is still the main thread.
William Bowe
Editor of The Poll Bludger
After running that through the machine, the result that spits out is Coalition five, Labor four, Greens two and Liberal Democrats one. If nothing else, the result offers some hints as to why the Greens were so keen on electoral reform.
———-
Thanks for doing a senate analysis William. I am sure we are all keen to know how hostile or otherwise the Senate is going to be for whomever wins this election. If this result in NSW is an indicator of things to come in the Senate, let alone a possible hung Parliament, it does not auger well for the effective governance of Australia following a DD election.
Thanks for the analysis, William. I’m looking forward to your results for the other states, especially Qld and SA.
One quibble: the respective columns for the Lib Dems and the Coalition are 4 and 6, not 2 and 4.
• The NSW state upper house is similar to the new federal system except you can just put 1. About 15% of voters preferenced above the line. Some examples of how 2nd preferences went
o Cyclists 47% Green, 14% Coalition, 12% Labor.
o Shooters 30% Fishers, 17% Coalition, 13% Labor, 11% Outdoor
o Animal Justice 24% Green, 13% Labor, 12% Coalition
• My estimate is that 5% vote against the two big parties rather than for a party. The Greens are the big losers when a personality party like Hinch, PUP, Xen run as they tend to take the votes that are against the majors that would vote Green when there is no other alternative. There is no big personality standing in NSW the closest is Leyonhjelm.
• Under the old system the minor parties preferenced the big 3 last. Under the new system parties put a major party 6. This is effectively last but means preferences don’t hit every other party first.
• The minor parties on the left of politics have splintered their vote. Consider parties like Animal Justice, Arts, Cyclists, Drug Reform, Voluntary Euth, Hemp, Marriage Equality, Pirate, Renewable Energy, Science, Secular, Sex, Sustainable Aust, etc. Voters will either number 6 of these and have their vote exhausted or select 5 and a major meaning 2 thirds of these parties miss out on preferences passing through.
• The family values/christian parties are likely to preference more tightly. In NSW state election Coalition 2nd preferences flow tightly (58%) to the Christian Democrats as did Christians Democrats to Coalition (71%).
I’d say 5 Coalition, 4 Labor, 1 Green, 1 Christian Democrat, 1 Liberal Democrat.
Pirate Party is Group arrr (Group R), couldnt have hoped for better.
Also number two on preference of Greens, unfortunately we 😉 will likely get knocked out before a greens preference will be useful.
I note that your analysis does not take into account the potential for a large exhausted vote.
The Australia Institute did a poll (see http://www.tai.org.au/content/polling-and-senate-voting-analysis) where they asked voters how they were actually going to vote: i.e. only a 1 above the line, 1 to 6 above the line, below the line etc. and the result gave 33% of the respondents saying they were going to vote 1 above the line – with 24% not knowing how they would vote. This suggests you may need to factor in a loss of one third of the transferred votes . The question is – what happens if this number of exhausted votes adds up to more than one quota.
ian mcallan @ #6 Friday, June 24, 2016 at 10:45 am
That is not a correct reading of that poll. The question asked was “To the best of your knowledge, what is the minimum number of boxes people have to number when they
vote above the line?” The 33% was those thinking that 1 was the minimum, not saying they would actually just vote 1. Many of those who think 1 is the minimum are just confused with the old Senate system and will change their view when they see the ballot paper instructions. Some would be aware that technically a just-vote-1 is allowed and might be answering on that basis. But that poll provides no evidence whatsoever on how many will just vote 1, and I am not aware of any party HTV card that recommends such a vote.
It may be that the proportion that just vote 1 is high anyway, but that poll will have nothing to do with it if so.
Just a comment….
At Hervey Bay Pre polling the Family First, Pauline Hansen and ALA were ALL telling people it was fine to vote 1 only above the line in the Senate. Many voters were happy with that advice as they didn’t want to Preference LNP, ALP or Greens and may well have voted that way, (of course they all listen to Ray Hadley on local radio)!
But we already know that the mahority of the Liberal Democrat vote in NSW last time was Liberal voters not reading either the ballot paper or the how to vote ticket , in fact I have heard it said that 7/41 of Liberal voters did so, or over 15% of Liberal voters. I think there is strong evidence that a large number of votes will exhaust before they get distributed to minor parties whether they are told to do so or not.
Ausdavo, i think the AEC will want to know if a political party is advising to Vote only 1, iirc they arent allowed to do that.
The reason the greens were so keen for the reform is that the never got the support from minor parties on their preference deals, with the exception of socialist alliance and sometimes a few minor others such as animal justice.
The new system gives them a better chance of being the highest left over quota and also, they could never do worse than what the old system delivered for them in the way of preferences.
On the issue of exhausted votes. In NSW voters can just put 1 above the line (and 85% do). Total exhausted votes at the last count was about 300k out of 4.3 million, 7%.
When you come to do your Victorian one, Will, do take account of Ricky’s very clever logo backed up by this very clever youtube ad: https://www.youtube.com/watch?v=aEJJXG2jPt8
Might be worth a percent or two?
I wonder if prior experience at voting OPV in the upper house in some states will see a difference in trend.