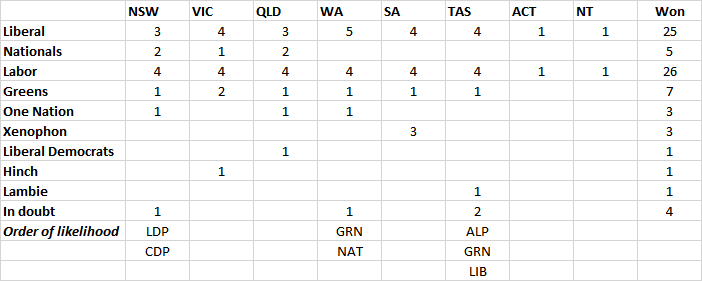
Now that things are winding down, some overdue consideration to the Senate, with a table at the bottom outlining where I perceive things to stand.
New South Wales
If preferences don’t change the order, the result will be Coalition 5, Labor 4 and one each for the Greens, One Nation and the Liberal Democrats. However, the Liberal Democrats just barely have their nose ahead of the Christian Democrats, which could potentially be reversed on preferences. Analysis of below-the-line votes from 2013 shows strong performances on preferences for both Liberal Democrats and Christian Democrats, but the Liberal Democrats would have the edge if nearly half of Labor’s voters follow the how-to-vote card, as they traditionally do for the lower house. Labor directed a sixth preference to the Liberal Democrats, and would have about 0.1 quotas distributed as preferences upon the exclusion of their fifth candidate. So it would seem that David Leyonhjelm is well placed to win the twelfth spot.
Victoria
The Coalition and Labor have enough full quotas to elect four each, the Greens have one, and Derryn Hinch is close enough that he’ll clearly win the tenth seat. That leaves the following contending for the last two seats: Greens #2 (0.39 quotas), Coalition #5 (0.34 quotas) and One Nation (0.23 quotas). Nothing in the past record of preference behaviour says One Nation will close the gap, so I think we can call this Coalition 5, Labor 4, Greens 2, Hinch 1.
Queensland
On full quotas, the Coalition elects four, Labor elect three and One Nation elects Pauline Hanson, while the Greens are close enough to a quota that Larissa Waters is assured of re-election. The front-runners for the other three seats are Coalition #5 (0.57 quotas), Labor #4 (0.49 quotas) and Liberal Democrats (0.35 quotas), unless Family First (0.25 quotas), Nick Xenophon Team (0.25 quotas) or the second One Nation candidate (0.17 quotas) achieve something extraordinary on preferences.
Western Australia
There are full quotas for five Liberal, three Labor and one Greens, with Labor #4 (0.70 quotas) and One Nation (0.50 quotas) assured of the next two spots. That leaves the last seat as a contest between the Nationals (0.34 quotas) and Greens #2 (0.33 quotas). The Nationals were outperformed by the Greens on below-the-line preferences in 2013, and the Liberals have very little to bequeath them in the way of a surplus, so the Greens seem the more likely winner at this stage unless their primary vote weakens significantly in late counting.
South Australia
A fairly clean result here, with four Liberal, three Labor and two NXT are elected off the bat, and NXT #3, Greens #1 and Labor #4 to follow shortly after.
Tasmania
The most fascinating contest is in Tasmania, given the very large number of major party voters who have gone below-the-line to give their votes to fifth-placed Liberal Richard Colbeck and sixth-placed Labor candidate Lisa Singh, who had been shafted by party powerbrokers in contentious preselection decisions. Ticket votes should be enough to elect the top four candidates on both Labor and Liberal tickets, with lead Greens candidate Peter Whish-Wilson and Jacqui Lambie also assured of seats, leaving two up for grabs at the end. Singh’s share of the Labor vote means that she rather than fifth-placed John Short will survive to the later stages of the count, and potentially emerge with Labor’s fifth seat. Colbeck’s vote may less consequential, since he holds fifth position on the ticket in any case, and would be just as well placed if most of his supporters had voted Liberal above the line. However, there is a potential scenario in which both Colbeck’s personal vote allows him to remain in the count concurrently with the fourth Liberal candidate long enough so that either McKim or Singh drops out ahead of them both, so that a fifth Liberal is elected at the expense of a fifth Labor or a second Greens. Such a result would deliver the Liberals a perverse benefit from giving Colbeck a low spot on the ticket and ensuring he received a vote base of his own.
Hi William,
Thanks for the run down – are you finding the Senate much harder to project now that preferencing is ‘essentially’ optional and unknown?
Also, might want to double check your table – eg. You have QLD Lib for 3.
Sorry, scratch my last comment on your table – I see what you have done.
That’s a great result for the Greens (assuming the likelies end up happening), with their last 4 senate results being: 3, 6, 4, 4.5.
For Labor, it’s: 18, 13, 12, 13.5.
For the Coalition: 18, 16, 17, 15.
In terms of balance of power, the Coalition needs 9 others to pass it, which means they can pass legislation with either Labor or Greens, or with 9 out of 10 of the others.
As LDP, ON and NXT all have at least 2 seats, they are required for any legislation that Labor and the Greens oppose. The coalition can afford to miss one of Lambie and Hinch, but not both.
In terms of the ABCC, if Turnbull actually does call a joint sitting.
Assuming that all seats end with the ‘likely’ candidate at the moment, (which the ABC says is Labor 69 HoR), then votes for will be
106 (Coalition)
Votes against will be 69+27+1+9 (Labor + Greens), +1 (Katter, who has made it clear that there will be no Union bashing under a government he leads and voted to kill the ABCC under Gillard) +3 (One Nation – just my guess, have they published a policy on it?) +1 (Lambie) +1 (Wilkie, who voted to repeal the ABCC originally) = 112 against.
Still undecided will be 4 NXT, 2 LD, McGowan and Hinch. 7 of these voting for, and 1 against would leave the numbers at 113 for, 113 against (which includes both the Speaker and President of the senate voting for), so would lead to the vote failing (I think votes need more than 50% to pass, right?).
I’d be inclined to put LD in the ‘for’ column, but there is always a chance that they will vote against it to punish Turnbull for the senate voting changes and DD – you ain’t seen feral yet.
Looks like we’ll need a triple dissolution to get the ABCC passed 🙂
William
could we have a chart of the old senate make up for comparison. The Question that comes to mind is was it worth for the Libs and the greens to push the reforms and did the Libs gain anything in the senate to make a DD worth while. Of course the waste of taxpayers money is a side issue does not count in their scheme of things anyway.
My coverage of Tasmania Senate:
http://kevinbonham.blogspot.com.au/2016/07/postcount-2016-tasmanian-senate_3.html
At the moment I am not even thinking about covering the others in detail, though I put some general comments up last week here: http://kevinbonham.blogspot.com.au/2016/07/2016-senate-postcount-very-long-way.html
The perverse-benefit scenario in Tasmania applies to both major parties; the Singh situation is making Labor’s chances of five look a lot less dicey (though still by no means certain) than if voters just voted down the ticket.
@ Bilko 9:03
“could we have a chart of the old senate make up for comparison.”
Current Senate is: Coalition 33, ALP 25, Greens 10, NXT 1, Lambie 1, LDP 1, Others 5
Kevin Bonham
A fascinating contest. A surprise to me is that Lisa Singh has not only disposed of John Short but that she has a shot of getting ahead of Catryna Bilyk as well. That would really stick it up the pre-selectors and I hope it happens.
I think Labor did better then expected in South Australia. It was predicted Xenphon would get four senate seats, and relegating Labor to three. Xenophon suggested Labor campaigning on penalty rates played a part in him not doing better SA. He can call it a lie, but I don’t trust Xenophon on industrial relations. He wavers on it, while some of the other minor parties have been more on definitive on not bringing in changes.
If I read the projections correctly, there’s a chance Labor + Greens will hold 36 seats, meaning that if they can get Xenophon on-board they can basically pass (or block) whatever they feel like? That would be an excellent outcome, if so.
…And the Coalition thought the -old- Senate were a rabble. So – any bets on how long till Turnbott spits the dummy and calls another DD?
If he does he’ll just get another rabble, or the same rabble re-elected.
matt @ #10 Tuesday, July 12, 2016 at 1:24 pm
lol
I suspect the very last thing on his mind would be a DD. He has had the narrowest escape. Another election would see him off and he knows it.
I think the election was more about Turnbull trying to safeguard his majority in the House/buy himself some extra time to fix his falling approval ratings than about trying to get a more workable Senate? Certainly it wasn’t because he really wants the ABCC back, considering that issue was barely mentioned at all.
I’d imagine that Turnbull is happy enough with his 76/77, and more concerned about solidifying his position as PM than about actually passing anything through the Senate. If anything, the unworkable Senate gives him a convenient excuse to continue doing basically nothing.
I notice the table has NT as 1 Liberal. Scullion sits with the Nationals, so should that be classified as a 1 National instead?
david @ #8 Tuesday, July 12, 2016 at 10:25 am
Both Labor and Liberals did better than expected, both with big swings towards them.
Hi William,
Re the QLD Senate situation, the Liberal Democrats are most unlikely, (I would say it’s impossible) to win a senate seat – they have not been preferenced by any other party.
The most likely however is neither X (elimated fairly early) nor Family First nor One Nation (although FF may pass LD and ON almost certainly will) – but KAP who will get preferences from DLP, GLT, and FF.
I would not expect much leakage from any of those. GLT and FF were both handing out cards at polling booths in QLD.
Further to above, when Greens finally get through on AJP and other prefernces, surplus goes to ALP leaving KAP, ALP and LNP with the last three seats, all ahead of One Nation (stranded).
I watched some QandA comment from Monday night describe the Greens as a spent force. Such nonsense. Looks like ‘balance of power’ in the Senate.
Not that i want to stir the pot, but there is no point having the balance unless your willing to negotiate responsibly. It all just gets undone.
http://kevinbonham.blogspot.com.au/2016/07/2016-tasmania-senate-model-of-what.html
Tasmania Senate: A Model Of What Might Occur
Based on scrutineering sampling (pretty small sample size so far) I get either 5 Labor 4 Liberal 2 Green 1 Lambie or 5-5-1-1.
Fargo, my working assumption here is, as Kevin Bonham puts it, that “all preferences splatter”, and that you are overestimating the influence of small party HTVs. Time will tell.
William, although preferences do splatter, the NSW LC election counts indicate that candidates can get substantive variations in the proportion of available preferences. Based on the 2013 election, the Std.Dev of the percentage of preferences a candidate gets above or below average is ~50% (50.8% with 5 candidates remaining, 58.6% with 10 candidates remaining). That potentially puts a lot of candidates in the running, if particular circumstances warrant a strong preference flow (well known, good ballot position – including proximity to similar parties or major parties). I’ve not analysed who might benefit from that, fwiw, I’ll leave that to those who’d know..
Analysing the current Senate count from a group ticket perspective (with appropriate caveats for BTL variations, particularly in Tasmania) gives the following numbers for the required flow above average for each candidate to overtake (or be overtaken by) the current leader (trailer). Showing +/- 70%, so assume they are safe/out where not shown.
NSW:
PHO -68.3% LDP -3.3% CDP +3.3% SFF +24.4% NXT +32.8% FF +68.1% ALP +69.4%
VIC:
GRN -24.4% LNP -19.3% PHO +19.3% AJP +23.0% NXT +29.1% SEX +32.6% LDP +39.1% FFP +53.3% SFF +64.2%
QLD:
ALP -46.3% LDP -16.8% NXT +16.8% FFP +17.5% KAP +24.4% GLP +28.7% PHO +42.4% AJP +51.6% ALA +61.0% SEX +69.3%
WA:
PHO -66.2% GRN -1.5% NAT +1.5% NXT +15.0% SFF +27.7% ACP+33.0% HEM +39.4%
SA:
ALP -43.6% PHO +43.6% FFP +49.0% LNP +67.1%
TAS:
ALP -10.5% GRN -8.2% PHO +8.2% FFP +16.6% LIB +24.1% NXT +31.6% SFF +40.9% SEX +50.7%
NXT is the most interesting party in this list. If they get strong preference flows they could easily move into contention in four states. There are still enough leftover quotas and close races to throw up at weird result or two.
The reality is that senate preferences this election are unpredictable. We have seen how they work with fully compulsory preferences, and somewhat with fully optional preferences (NSW and QLD state elections), but never with partially compulsory preferences. Now that ATL preferences are possible and BTL preferences are less onerous, we don’t know how well voters will follow a HTV. We don’t know what sort of exhaustion rates we will see. If we see high exhaustion rates and/or high variations from the HTV, then I doubt we will see parties making up the 0.2 quotas some people are suggesting they will.
Matthew, that’s a good point, an an addendum. The variation on flows in the NSW LC was based on actual vote preferences. Including exhausted votes, the std.dev. of the count with 5 exclusions to go was 21.3% and at the final count 9.1%. But that is on an unusually large ballot, with no requirement to number past 1 ATL, so I’d still not rule out candidates who need flows around 30-40%.
Russ, I would imagine though that there’s a strong relationship between a party’s level of primary vote support and the flow of preferences to it, and that this means the standard deviation will be a lot lower if you’re just looking at parties with a roughly similar primary vote – as we’re doing here.
William, that is correct. The preference flow for major parties is (raw figures above 40% at the final stages of the count) whereas the minor parties were generally falling behind at the same rate. But note that the numbers I calculated were from transfer differences with 10 candidates remaining and 5 remaining – all with relatively similar votes (or left over votes). I didn’t check earlier in the count where parties with tiny votes were being counted because it isn’t relevant to the final count.
Those numbers aren’t discernibly different to the Senate races under discussion. With 10 remaining candidates the largest difference was Field (GRN) +121% above average and Nile -60.65%. In the final count Houssos (ALP) had 81.8% (up from 45.6%) and Nile, -39.4%. Those are the raw percentages, stated earlier, ignoring excluded votes. So I think it is reasonable to expect some parties to do much better or worse than random in these Senate counts, the question is who, and by how much?
To add to Matthew’s earlier query about exclusions: at the NSW LC the average number of ATL preferences was less than 2, so the probability of a randomly preferenced vote exhausting is (total_candidates-number_remaining)/total_candidates or 21/26 (80%) – the true figure is 70%. In the Senate there are at least 6 preferences written (average 7?) which means the expected exclusion rate will be much lower ((TC-NR)TC)^6: ~40-45% in NSW, VIC, TAS and QLD. 25% in WA, 33% in SA. Adjust down by 20% for non-randomness, and there are a LOT of votes going somewhere.
Given that, my best estimate of the preference variation is somewhere between 15 and 30% in either direction (including exclusion), which adds a reasonable amount of uncertainty to the final count. Though as the major parties are mostly in front, odds are they will stay there.
Election Result 2016.
A win for patriots and a slap on the face for those that put ‘feelings’ above facts.
While you deny facts expect the rise of you know who (and others) to continue.
Eventually, like in Britain, the tide will turn and proper power will be restored to the rightful inheritors of the land – those that can claim kingship with the land and its original inhabitants going back generations and who maintain their duty to protect those rights and those people.
Reading this thread to get a handle of where the senate might end up.
Seems like there’s three seats in doubt:
In Tas between GRN/LIB
In WA between GRN/NAT
In NSW between a religious or atheist RWNJ
Is that a fair summary of where we’re up to? Anything else likely to change?
So that would mean ALP+GRN will end up somewhere between 35 to 37 seats. If it’s at the high end they’d need a single vote to block anything and the LNP would need to entire cast of fraggle rock to pass something.
Make that 34-36
36 ALP/Green would be a dire outcome for the Coalition because in the areas of health, education and I suspect tax as well, Lambie may as well be Labor. If the Liberals only manage four then Tasmania is sending an 8-4 left-right block on such issues. So the Coalition would then need all the rest to pass core legislation.
William – SA is not quite clearcut. The Liberals have about a 0.32 quota surplus and still going up, ALP 0.56 and still going down and Family First 0.36. FF will get a reasonable share of the ruck of right wing minors as they are fairly well amongst them – nearby preference bias plus some conscious preference bias. Assuming FF are ahead of Liberals at exclusion time then a reasonable % of Liberals voters will follow their HTV to FF. That puts the 4th ALP seat at some risk.
The minor left groups will see some ALP preference gain but also a fair bit will be soaked up by Greens being well below quota. I can see quite a proportion of preferences from minors going to both ALP and Liberal (which is the big shift from the party directed GVT resulting from the new voting system). Hopefully enough in SA to give Mr Day time off to fix up his business interests rather than live off the public purse.
I know counting for the Senate is glacial at best, but I’m not detecting any change in Labor’s Tas votes in the past 24 hours. I suppose they’ll count them eventually.
Tasmania has just updated, I’m just processing it.
Good, Kevin. I don’t know if this is a valid calculation or not, but yesterday I determined the rate that Lisa Singh was earning votes from the Labor pile in each electorate to project a state total of about 9,400 when counting is complete. Today the same calculation gives me about 11,700.
Oops, I just noticed that my calculations were only for ordinary votes. She’s getting some postal votes too, so they will be too low.
Tasmania numbers for ALP seems like the ticket group votes have gone down slightly, which individual candidates getting slightly more votes each. Now 84% of the apportioned votes have gone to the group (down from 88%), and Lisa Singh has seen a rise from 7.76% to 10.07%.
My rough excel calculation sees a contrast to Triton’s at 10674 projected total for Lisa Singh (from 8226) but seeing that the number has wildly jumped for her, this is extremely unpredictable.
Does this rise in Singh`s vote give her a chance at quota?
A quota of her own primaries?
My figures are incomplete, but in the same way both days so I think the rate improvement I found for Singh is valid and you’ve found that also. Denison is her goldmine electorate.
I agree with Wakefield – situation in SA isn’t clearcut. ALP = 0.57, Lib (0.31) + FF (0.36) = 0.66. FF is #2 on the Liberal HTV. Preferences scatter for micros, but Lib voters follow their HTVs at >50%. And as mentioned by Wakefield, since the greens haven’t been elected yet they’ll be absorbing many of the left micro preferences. ALP would probably still be favoured, however FF may have a 1 in 3 chance.
My numbers currently show that she’s got half a quota (assuming John Short falls far… short).
With votes exhausting, she stands a chance.
But only for a short term Senate position. If she was getting a quota on her own primaries, a tall over even in Tasmania, she would be in line for a long term Senate seat if the first elected system is used again.
All the calculations of the Singh vote that people have posted since my last post are incorrect. The reason is that the totals showing on the AEC site include some booths and some post-count categories that are either appearing only as (Ticket Votes or Unapportioned), or only as Ticket Votes. Booths are perennially being added to or removed from the totals that have no BTL votes showing, and if you look at the current totals for Bass there are 3586 postals listed as Ticket Votes but no postals counted as below the line. It makes those candidates dependent on BTLs look like they are doing much worse than they are. David Barry, Ben Raue and I have been looking at this based on those booths that actually show BTL votes and we have been getting similar figures.
My site includes projections for their actual totals based on booth votes – currently just over 6% for Singh and 4.4% for Colbeck – but it is impossible to project the non-booth votes as it is unclear yet to what extent (if any) the same problem applies to those post-count categories for which some BTL votes have been separated.
On this basis I believe Singh is on track to be elected ninth or tenth while Colbeck is struggling, but still with some chance of winning, probably at the expense of McKim or Bushby if so.
The preference flows for the Liberals here are poor even from sources like One Nation – as would be expected from them getting wiped out in the Reps in the state.
From a display of information perspective what has been going on is a real problem and I will be saying lots about it in the next round of JSCEM.
By the way in Tasmania the Liberal HTV card follow rate is a lot less than 50%. Probably not even 25%. Not that it matters since fortunately the Liberals’ Tasmanian #1 ATLs will never reach the collection of bible-thumpers, gun-toters and outright homophobes that the party has unfortunately preferenced. We can thank Richard Colbeck’s high BTL vote for that.
“David Barry, Ben Raue and I have been looking at this based on those booths that actually show BTL votes and we have been getting similar figures.”
To each other of course – not to those who have Singh on only half a quota.
You must be fun at parties… 😛
Seriously speaking though, why is there the discrepancy in the figures between booths? I defer to your expertise on the counting of Senate votes.
wakefield @ #31 Wednesday, July 13, 2016 at 11:55 pm
Where will the One Nation vote go?
It will play a big role in what happens assuming FF get ahead of the them.
FF in SA are almost completely tied up with the Assemblies of God Church/Australian Christian Churches – pentacostal clappers. They have about 15-20,000 members in SA which is about 1.5% of the voting population in SA. Their total first preference vote will only be 30,000. Despite being known for this they got wide preference support from Liberals and other RW groups.
ON put FF second on the ticket on their website. FF put ON 5. FF have a pretty good network of captive HTV people but ON had very few. I doubt that preferences will flow much like the tickets – as William and KB have been saying and based on limited data in SA. Wouldn’t be surprised to see NXT Labor and Liberal do nearly as well or as well as FF from ON preferences – but Greens not so much. Quite a few will probably exhaust for those seeking the nuttier options. I don’t think Bob Day would appeal much to the average ON voter.
raaraa @ #46 Thursday, July 14, 2016 at 8:51 pm
Hmmm, yeah, if you’re going to make silly snide comments about my social life I can’t be bothered answering.
kevin bonham @ #49 Friday, July 15, 2016 at 12:01 am
Sorry KB and I retract my statement. I didn’t intend to offend and I thought I was being silly rather than snide. I definitely don’t consider myself an expert on social life.