Wherein we finally wrap up the Call of the Board series, a slowly unfolding state-by-state round-up every seat result from last year’s federal election. Here we tie up the loose ends of the territories, where Labor achieved a clean sweep of five seats – an essentially foregone conclusion for the Australian Capital Territory (which went from two to three seats at this election), but a strong result for them in the Northern Territory (which may be set to lose its second at the next). Previous episodes of the series dealt with Sydney (here and here), regional New South Wales, Melbourne, regional Victoria, south-east Queensland, regional Queensland, Western Australia and South Australia and Tasmania.
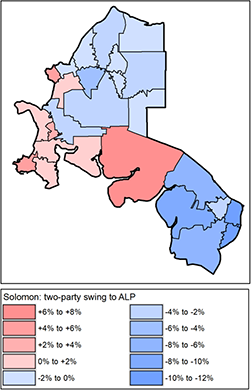 Solomon (Labor 3.1%; 3.0% swing to CLP): The always marginal seat that covers Darwin has only gone the way of the winning party once out of the last four elections (in 2013), this time returning Luke Gosling after he gained it for Labor in 2016. Gosling’s 6.0% winning margin off a 7.4% swing in 2016 was the clearest win in the history of a highly marginal seat, the previous record having been Dave Tollner’s 2.8% win for the Country Liberal Party in 2004. This meant he had enough change to record the seat’s second-biggest margin even after a 3.0% swing back to the Country Liberals. As the map to the right illustrates, the pattern of swings in the seat reflected broader themes from the election: the affluent area around the city centre swung to Labor, but the lower-income suburbs of the north went the other way, and the more conservative new suburbia of Palmerston went further still.
Lingiari (Labor 5.5%; 2.7% swing to CLP): Warren Snowdon retained the remainder-of-NT seat of Lingiari, which he has held without interruption since 2001, his closest shave in that time being a 0.9% margin in 2013. The swings in the two Northern Territory seats have been closely matched at the last election, with a 7.5% blowout in Lingiari in 2016 followed by a 2.7% correction this time. There have been occasions in the past where swings varied widely between Alice Springs and Katherine on the one hand and the remote communities in the other, but not this time.
Bean (Labor 7.5%; 1.3% swing to Liberal): The ACT’s new third seat was created entirely from territory that was formerly in the Canberra electorate, whose member Gai Brodtmann did not seek re-election. David Smith, who had previously filled Katy Gallagher’s Senate vacancy when she fell foul of section 44 in May 2018, had no trouble holding Bean for Labor in the face of a slight swing. Left-wing independent Jamie Christie scored a creditable 8.3%, contributing to solid drops on the primary vote for both major parties.
Canberra (Labor 17.1%; 4.1% swing to Labor): The Canberra electorate covers the central third of the capital, and might be regarded as the true “new” seat since it drew territory from both of the previous electorates. Like Darwin, Canberra offered a miniature reflection of national trend in that the city’s inner area moved solidly further to the left, while the suburbs swung to the Liberals. This was reflected in a 4.6% primary vote increase for the Greens, reducing the gap with the Liberals to 27.8% to 23.3%. This is the lowest yet recorded in an ACT seat, but with the Liberal how-to-vote directing preferences to Labor ahead of the Greens, they would probably have remained out of contention if they had made up the difference. With the departure of Gai Brodtmann, its new Labor member is Alicia Payne, who dropped 2.0% on the primary vote to 40.5%.
Fenner (Labor 10.6%; 1.3% swing to Liberal): Labor’s Andrew Leigh suffered a slight swing from similar primary vote numbers to 2016, the main disturbance being the appearance of the United Australia Party with 4.1%.