Two points to emerge from our friends in the polling community, which passed notice while I’ve been diverted by close counts:
• ReachTEL has published a helpful table illustrating pollster accuracy, which is sporting of them given the attention it calls to the eye-watering accuracy of Newspoll. However, all concerned did very well in predicting a two-party preferred result which, by my back-of-envelope reading, will ultimately settle at around 50.5-49.5 to the Coalition. Essential and especially Ipsos overshot on support for the Greens, with the latter landing around 2% too low for both major parties, but the only other substantial errors involved the balance of support between the Liberals and the Nationals, which I don’t regard as particularly important. Electorate polls were a different matter, and will be looked at in greater detail when all the results are in.
• On the Tuesday evening following the election, Roy Morgan conducted an SMS poll poll from 3587 respondents on leadership approval. The poll had Malcolm Turnbull with a narrow 51-47 lead as preferred prime minister, which the Morgan release sets up for comparison with a 57-24 result from May. However, the May result was an interviewer-administered phone poll, a method evidently less conducive to a “neither/can’t say” response. The poll also found Malcolm Turnbull leading Tony Abbott by 71-25 as preferred Liberal leader, and Anthony Albanese leading Bill Shorten 49-48 for Labor.
Now to an exercise I’ve conducted to get a clearer sense of what sort of areas did and didn’t swing. The chart below shows results of a regression analysis on 6582 polling booth results in which two-party swing data was available, which excludes the 14 electorates where the AEC’s two-party count is not between Labor and the Coalition. The purpose here is to discern if the swing to Labor was more or less evident in areas with particular demographic characteristics. The results record a big move back to Labor in the ever-volatile mortgage belts; an apparent failure of the Abbott-to-Turnbull leadership switch to improve the Coalition’s standing in ethnic communities; and better swing results for the Coalition where voters were wealthier and better educated, and – perhaps more surprisingly – older.
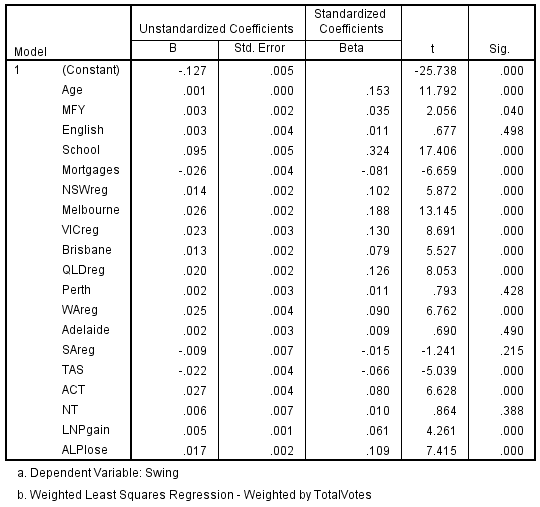
After the constant and starting with “Age”, the table lists the associations between polling booth swings to the Coalition, which in practice usually means negative results recording swings to Labor, and five demographic variables for the census districts in which the booths were located. All but one of these variables, English spoken at home, records a statistically significant association with the swing, as indicated by a score of less than .05 in the significance column on the right. The “B” coefficient of .001 for “Age” tells us that areas with a median age of 40 would generally swing 1% more favourably for the Coalition than areas with a median age of 30. “MFY” stands for median weekly family income and is measured in thousands, so the coefficient means swings tended to be 0.3% stronger for the Coalition for every $1000 of average household income. “School” represents the percentage of the 18-plus population who had completed high school, every point of which associates with nearly 0.1% of swing in favour of the Coalition. Conversely, Labor did 0.02% better for every percentage point of mortgaged dwellings.
The five demographic variables are followed by geographic ones that are there to ensure the results for the demographic variables aren’t influenced by regional differences in the swing, particularly those from state to state. Sydney is excluded so it works as a baseline, so the coefficient for Melbourne tells us that the Coalition would typically do 2.6% better there than at a demographically identical booth in Sydney. Finally, two variables are listed to control for retiring member and sophomore surge effects, which prove to be significant in both cases. “LNPgain” was coded 1 where the candidate was a Coalition sophomore and -1 where a Coalition member was retiring; vice-versa in the case of Labor sophomores and retirees; and zero where neither applied. “ALPloss” was coded 1 where Labor lost the seat in 2013 and 0 otherwise, to measure the boost to the sophomore effect in seats where Labor had a sitting member defending last time. The results suggest Coalition members who won their seats from Labor in 2013 did 2.2% better in swing terms than other Coalition candidates, which reduces to 0.5% in seats where they were replacing retiring Coalition members.
To observe these effects in action, the four tables below identify the 15 highest and lowest ranked electorates by the four statistically significant demographic indicators, and show their two-party swings to the Coalition where available. The lowest education electorates, all of which are regional, were 4.0% worse for the Coalition than those at the top of the scale, of which all apart from Fenner in the ACT are near the centres of the largest cities. Median age was more of a mixed bag — old electorates are regional, but the young ones encompass inner cities, mortgage belts, enclaves, a defence town and the largely indigenous seat of Lingiari. Nonetheless, the distinction here is as great as it was for education, and not in the direction that might have been anticipated from a touted backlash over superannuation policy.
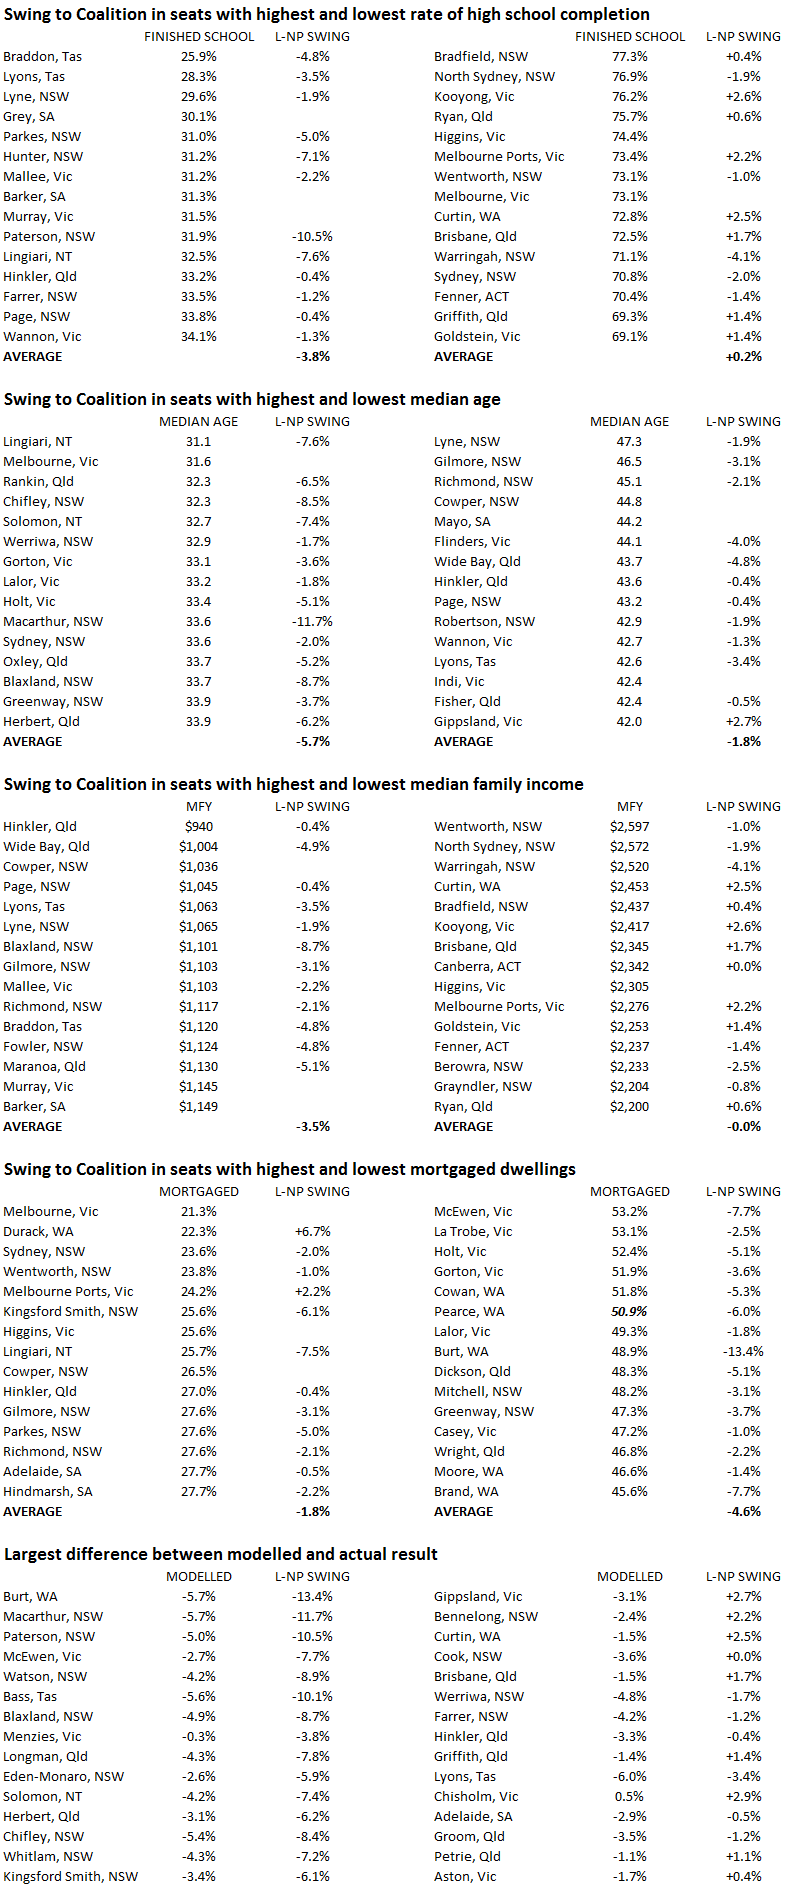
The lowest income electorates, all of which are regional other than two in Sydney, recorded an average 3.5% swing to Labor, only slightly above the national result. But the results for the Liberals were well above average among the wealthiest electorates, over half of which swung in the Coalition’s favour. The mortgage effect is more modest, with 2.8% separating the averages for the top and bottom fifteen. Electorates at the top end of the mortgaged dwellings table are all in the outer suburbs of big cities, but the bottom end is a dissonant mix of regional and inner-city areas, producing a wide range of swing results.
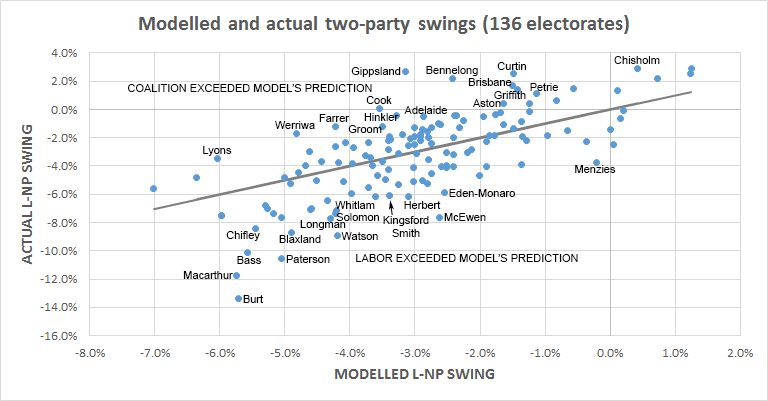
The extent to which this exercise actually explains the results is illustrated by the chart below. For each electorate, the result the model would have predicted is plotted on the horizontal axis, and the actual result is plotted on the vertical. The electorates identified by name are those where the Coalition most under-performed or over-performed the prediction. Keep in mind that this accounts for regional as well as demographic factors, so Lyons shows up as a strong Liberal performance because the swing there was lower than in the other three Tasmanian seats included (remember Denison is not included due to its lack of two-party swing figures). Most electorates’ results were within 2% of the prediction, but a good many had results where alternative explanations are substantially required.
Thanks, Barney!
Douglas and Milko got me off on the right foot though. : )
meher baba,
BTW re Dastyari: he seems to provide different stories about who he is and where he came from. I had long been under the impression – based on some puff piece or other from years back – that his father was an Azeri and his mother a Iranian Christian. But these he talks about himself as a sort of “non-practising” Muslim. Does anyone know the full story?
As I understand it, you are correct about the mixed marriage of Sam’s parents. Though, as a Zoroastrian, Sam’s father, and maybe Sam himself, could describe themselves as variously Christian, Muslim or Jews!
Zoroastrianism is the ancient, pre-Islamic religion of Persia (modern-day Iran). It survives there in isolated areas but primarily exists in India, where the descendants of Zoroastrian Persian immigrants are known as Parsis, or Parsees. In India the religion is called Parsiism.
Founded by the Iranian prophet and reformer Zoroaster in the 6th century BCE, Zoroastrianism contains both monotheistic and dualistic features. Although a fairly small religion today, numbering about 200,000 adherents, it shares many central concepts with the major world religions of Judaism, Christianity, and Islam.
Now, as I also believe, after the Iranian Revolution there was an edict issued to those who were not Muslim that they must convert to the State religion. So Sam’s parents escaped rather than fully convert to Islam and came to Australia as religiously-persecuted minority refugees.
Hope that helps!
meher baba @ #1029 Tuesday, July 19, 2016 at 12:50 pm
It is tricky when ideas are set in holy scripts. It is a tricky subject for us who are outside of it. I don’t believe outside pressure from concerned persons will accomplish anything but to offend and make people cling more. I compare to the bible which has some pretty radical laws and suggested punishments written within it’s pages but even people who consider it the written word will say they were relevant and necessary in the times it was written but not so today.
I just don’t know and yet here is where I take my own leap of faith. I always think that if people are choosing to want to live in a multi-cultural society, that must be a good thing and that over time ideologies will naturally evolve in such an environment that welcomes diversity. I suppose only time will tell. I will regardless stay true to my own beliefs which is to respect other peoples freedom of religion because that is my faith. That is my religion.
shea mcduff @ #1052 Tuesday, July 19, 2016 at 1:47 pm
Shea, it is you who are misunderstanding. Using party percentage swings alone ignores the fact that a one percent swing for the Greens equates to a great deal less people than a one percent swing for Labor. Are you understanding now what C@t was saying? Far more people decided to vote Labor this time who didn’t last time, than those who decided to vote Greens who did not last time.
P.S. You are forgetting the senate again too in which even your swing argument falls flat.
psyclaw @ #1059 Tuesday, July 19, 2016 at 2:10 pm
I am really glad to read this right now because that’s what I think. I was brought up Catholic too with talk of everyone going to hell who is not Catholic, hellfire, brimstone and all of that. Only 20 years ago to marry outside ones religion was seriously frowned upon, divorce, separation, having a child out of wedlock and so much besides was not too long ago thought to bring the family shame. As the influence of religious leaders and peer and family pressure subsides so does the power of religious dogma. I think you are right and environment counts for a very great deal. I feel heaps better. Cheers!
LU
So there can only ever be 21 million bitcoins? What a boon for collectors! Someone could conceivably collect the whole set!
Of course, even if someone did, they’d still be basically valueless.
don @ #1064 Tuesday, July 19, 2016 at 2:22 pm
I just think a set of set beliefs relating to religion is a religion of sorts. That’s all. I use the word religion informally at times. My point of view or opinion, not a fact. I don’t know what I am, kinda neutral, maybe agnostic. I neither believe or not believe in a basis to the idea of God. Maybe that’s my religion, being a happy undecided. 😀
player one @ #1069 Tuesday, July 19, 2016 at 2:32 pm
Hahahahahaha
I have a confession to make.
I do not collect gnomes. *redface*
Australian cycle team Orica BikeExchange have their own youtube channel which has become very successful.
https://www.youtube.com/watch?v=gJAT7QbDex0
When all the booths are done, do they have to go through all the pre poll, absent. postal and provisionals again ?
Rogue – tweet from AEC that Labor has won Herbert. Time for malcolm to charge recklessly into the breach, methinks.
https://twitter.com/AusElectoralCom