You might do best to read this post in tandem with the previous entry on inner Sydney, which in several respects produced interestingly different electoral dynamics from the seats covered here. As before, I am going off the Australian Electoral Commission’s electoral classifications here, these being the seats it designates “outer metropolitan” – except that, for the table below, Cook has been reassigned as outer metropolitan and Mackellar as inner. Note that the One Nation swings are inflated by the fact that the party contested all eleven outer metropolitan and fifteen inner metropolitan seats this time, after doing so in only three and one respectively in 2019.
| Inner Sydney | Outer Sydney | |||
|---|---|---|---|---|
| % | Swing | % | Swing | |
| Primary vote | ||||
| Labor | 35.2% | -0.9% | 36.1% | -3.6% |
| Liberal | 33.5% | -7.8% | 37.5% | -6.2% |
| Greens | 11.4% | +1.1% | 8.2% | +2.1% |
| UAP | 3.6% | +1.7% | 5.6% | +2.7% |
| One Nation | 2.6% | +2.3% | 4.7% | +2.8% |
| Independent | 12.0% | +8.9% | 4.8% | +4.6% |
| Others | 1.8% | -5.4% | 3.1% | -2.5% |
| Two-party | ||||
| Labor | 56.5% | +5.1% | 50.6% | +2.6% |
| Liberal | 43.5% | -5.1% | 49.4% | -2.6% |
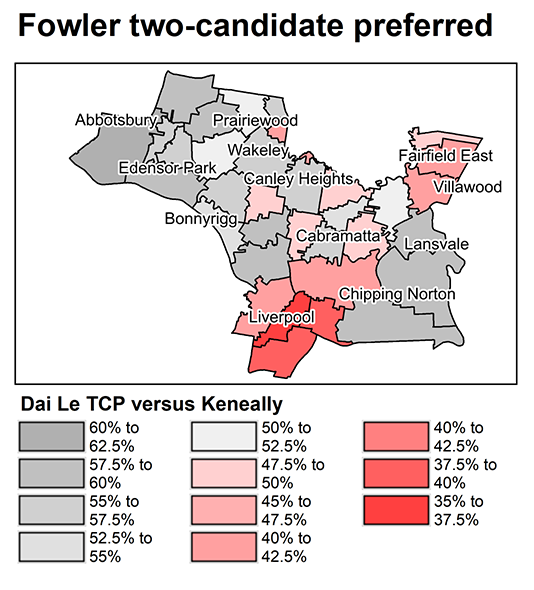
As with last week, we begin with colour-coded representations of their booth results, with two-party preferred on the left and the swing on the right. Being two-party measures, these boil the contests down to Labor-versus-Liberal, including where the final preference counts involved independents (which get maps of their own further below). Click on the image for a closer look.

Now for the blow-by-blow account.
Berowra (Liberal 9.8%; 5.9% swing to Labor): Julian Leeser was perhaps fortunate to be spared a teal independent challenger in his historically safe Liberal seat, but he nonetheless copped an 8.1% hit to the primary vote that ran about two points above the statewide norm, with more going to the Greens than to Labor.
Chifley (Labor 13.5%; 1.1% swing to Labor): A more-or-less status quo result in a seat prone to heavy swings, which failed to restore Ed Husic to the peaks Labor enjoyed here in 1998, 2007 and 2016. Both major parties were down a little on the primary vote, Liberal by 3.2% and Labor by 1.6%, with much of the balance accounted for by the entry of One Nation, who scored 6.2% from the top of the ballot paper.
Fowler (INDEPENDENT GAIN 1.6% versus Labor): Labor’s primary vote crashed by 18.5% on Kristina Keneally’s watch to 36.1%, leaving her well below what a major party candidate typically needs to feel comfortable when an independent outpolls the rival major party. Independent Dai Le had little trouble accomplishing this, polling 29.5% as the Liberal vote crashed 12.9% to 17.2%, partly mirroring the experience of teal independent seats where left-of-centre voters favoured the stronger anti-Liberal horse. For this reason, Le’s support did not tidily map against the concentrated Vietnamese community at the heart of the electorate in Cabramatta — she actually owed her victory to big wins in booths at the electorate’s less multicultural western end, with the Cabramatta booths breaking roughly evenly. Labor retained majorities in the booths around Liverpool in the electorate’s south, whose ethnic mix tends more towards Arabic. A surprisingly large 28.1% of Liberal preferences leaked to Keneally ahead of Le, along with 31.0% from the United Australia Party and 34.8% from One Nation, but Le managed 35.5% of preferences from the Greens.
Greenway (Labor 11.5%; 8.7% swing to Labor): One of the most intriguing details of the election result, for which I await a clear explanation, was the savaging the Liberals copped north of the Westlink in this distinct electorate of two halves, where affluent new suburbs in the north contrast with more established, lower-income and more naturally Labor-friendly territory in the south. I related during the campaign a seemingly well-made observation by pollster Kos Samaras that an enrolment growth of nearly 10,000 concentrated at the northern end since 2019 boded ill for Labor. In the event, swings to Labor here were almost all cases in double figures. Random example: Riverstone East broke 865-670 to Liberal in 2019 and 1075-688 to Labor in 2022. The swing in the southern half was still solid enough, converting into an 8.7% swing overall that was second to Bradfield (see previous post) as the biggest in the state in two-party terms. Labor only harvested 2.3% from a 10.8% drop in the Liberal primary vote, the balance being a typical story of the United Australia Party finding room for a slightly higher primary vote despite facing fresh competition from One Nation and the Liberal Democrats.
Hughes (Liberal 7.0%; 2.8% swing to Labor): Craig Kelly’s hypnotic charisma and status as his party’s Prime Minister-designate failed to translate into particularly strong support for the United Australia Party, whose 7.4% share of the primary vote was exceeded in McMahon and Werriwa. While they were competing for seemingly very different electoral markets, he may have been constrained by competition from two candidates classifiable as teal independents, of whom Georgia Steele emerged much the stronger with 14.3% to Linda Seymour’s 3.2%. A solid flow of Kelly’s preferences would have assured Liberal winner Jenny Ware of victory even if Steele had snuck into second place, but in the event she amassed only 22.38% at the last exclusion compared with 28.13% for Labor’s Riley Campbell and 49.48% for Ware.
Lindsay (Liberal 6.3%; 1.3% swing to Liberal): The much-hyped “Lindsay test” was definitively put to rest at this election by the second biggest winning margin the Liberals have ever recorded in the seat, just shaded by the by-election resulting from Labor’s ill-advised legal challenge against Jackie Kelly’s first win in 1996. Swings were fairly modest across the board, but tended to go Labor’s way in their weakest parts of the electorate, namely the semi-rural north and south, while the core around Penrith and especially St Marys went to the Liberals.
Macarthur (Labor 8.5%; 0.1% swing to Labor): Labor member Mike Freelander did his reputation as a strong electoral performer no harm in recording a status quo result after gaining the traditionally marginal seat with an 11.7% swing in 2016, then holding steady against the trend in 2019. One Nation’s 8.0% was their best result in Sydney, although it didn’t quite match their 2019 result in the face of a 3.4% bump for the United Australia Party to 5.9%.
Mackellar (INDEPENDENT GAIN 2.5% versus Liberal): A seat I would have covered in last week’s instalment if I had my time again, so as to bring the teal independent seats under one roof. The map below adds the seat to last week’s effort showing colour-coded independent-versus-Liberal two-candidate booth results, showing a slight Liberal advantage at the western edge that carried over into neighbouring Bradfield, where Paul Fletcher was able to hold on. But in Mackellar — and particularly around Avalon Beach at the northern coastal end – Liberal member Jason Falinski was decisively outpointed by independent challenger Sophie Scamps, who polled 38.1% in a seat where third-placed Labor fell well short of double figures. Falinski’s vote was down 11.6% to 41.4%, compounding the 11.3% drop he suffered when independents first came out of the woodwork upon his debut in 2016 and only partially recovered in 2019.

McMahon (Labor 9.5%; 2.9% swing to Labor): The 2.9% swing to Labor’s Chris Bowen was slightly better than the party’s outer Sydney norm, as was a 1.9% increase in his primary vote that may have been assisted by his top position on the ballot paper. This was despite a 9.1% vote for the United Australia Party, up from 3.9% in 2019, its strongest result in New South Wales.
Mitchell (Liberal 10.7%; 7.9% swing to Labor): Liberal member Alex Hawke’s factional activities on behalf of Scott Morrison have borne a certain measure of the blame for the government’s defeat, and potentially help explain a 9.4% drop in his primary vote and a 7.9% two-party swing to Labor, albeit that the party did even worse on both counts in neighbouring Greenway.
Werriwa (Labor 5.8%; 0.4% swing to Labor): There have been suggestions that Gough Whitlam’s old seat (unrecognisable though today’s incarnation of it may be) might represent the Liberal Party’s electoral future, wherein an anti-woke outer suburban constituency could potentially balance the permanent loss of its prestige blue-ribbon seats to teal independents. This notion, which partly explained the emphasis the Liberals placed on Katherine Deves during the campaign, was only supported by the Werriwa result to the extent that Labor member Anne Stanley’s primary vote fell by 7.9%. But the Liberals were down too, by 4.6%, the narrative depending on the latent potential of the 8.9% who voted Liberal Democrats (probably creaming off a certain amount from confused Liberal supporters one last time after drawing top position on the ballot paper), 8.8% for the United Australia Party and 5.1% for One Nation. It can’t be encouraging for the Liberals that they got barely more than half the preferences from these parties, such that Labor’s weakened primary vote failed to translate into an adverse two-party swing.
Can we please keep this thread relevant to the content of the post. The general discussion thread continues here.
William I found a mistake, Werriwa and Macarthur are in blue despite being both won by Labor (on your analysis)
Interesting results:
a) In Inner Sydney the ALP more or less held their ground, but the Liberals were badly bashed (so much for the Scomo Sydney-based strategy to “victory”…. Ha!). Obviously, the Teals were the true novelty there.
b) In Outer Sydney, both ALP and Liberals went significantly backwards, although the latter more than the former. Interestingly, however, all other alternatives did well: “far” right, “far” left and Teals. So, the vote shows a protest against the so-called “duopoly”. I am not sure whether there was genuine and similar disappointment with Libs and Labs, or whether there was an effect of propaganda where pro-Liberal party media, sensing a serious bashing for the Libs, preferred to push the idea that Libs and Labs are just the same, so you may as well toss a coin with your preferences for those.
Thanks William for this continuing and intriquing seat by seat analysis of the 2022 Election.
In your comments regarding McKellar, you make reference to Avoca Beach.
Avoca Beach is in Robertson, where I live. I am sure that really meant to refer to Avalon Beach which is definitely in McKellar.
A very good and interesting post William. For me, some of the most interesting bits concern the electorate of Fowler. Dai Le did not poll as well among the Vietnamese community as many might have thought; apparently many of these voters deciding to put their pro-Labor loyalties first. It’s noteworthy that Le did poll quite well among non-Asian voters in the electorate.
But the most interesting bits were that Labor’s Kristina Keneally garnered 28% of Liberal preferences and Le picked up 35.5% of Greens preferences. I don’t know what motivated so many Liberal voters to prefer a Labor candidate to a conservative independent. Perhaps they viewed Le as a traitor because she was expelled from the Liberal Party for opposing an endorsed Liberal candidate for council.
As for Greens voters, they can be fickle. Maybe all the talk about a “nasty” rightwing Labor person being “parachuted” into the electorate was why so many preferred a conservative independent of Asian background to an American-born Labor politician.
@Alpo: I would advance a third theory, that the both-sides damage is the result of three separate factors:
1. The anti-trans campaign playing well among socially-conservative, traditional Labor voters. We’ve seen this in other countries; the working(ish)-class outer suburbian, often blue-collar, historically left-wing voters (UK Labour, Labor, Democrats, etc.) have on occasion been successfully wooed by an appeal to social conservatism. Overall, it clearly was not a net vote-winner, but in some parts of outer Sydney (and outer suburbia generally), I think it was a local net vote-winner, just by not much.
2. The “both parties are just the same” narrative, promulgated by the Australian MSM, who have elevated whataboutism and false equivalence to an art form in service to their pro-Coalition owners. Also eagerly furthered by the Greens, UAP, PHON and generally every whacko minor party out there to try to harvest the disaffected.
3. Genuine disgust at Australia’s political system, which to an outside perspective appears to exist largely to enable and protect corruption, sexual harassment, pork-barreling, elitism and deliberate attacks on the broader Australian people to benefit a handful of well-connected rich folk. As one of the “establishment” parties, Labor was always going to cop some of that disgust, however unfairly.
More fascinating analysis! I think the dreadful result for the Liberals in Greenway, my own electorate, was at least partially due to the disarray within the NSW Liberal party. There were no official Liberal candidates at the Blacktown Council elections in 2021, due to some sort of factional warfare-this happened elsewhere in Sydney too. The Liberal campaign in Greenway was almost non-existent. Their candidate was selected very late and had zero local profile, there was near-zero signage for him, and there was little presence with workers at the polling booth. On the other hand Michelle Rowland I think is well-regarded, has family links to the strong local Indian community, and had a well-resourced campaign. But the size of the swing was still a surprise.
I remember Hughes as a safe ALP seat in years gone by. But now it’s quite safe Liberal, so it’s gone down the same path as neighbouring Banks. What is it with the demographics of southern Sydney which is driving this?
@Sir Henry: No need for the scare-quote marks around “parachuted”. KK was parachuted into what appeared to be a very safe seat, right after losing out in Senate ticket preselection. And I can understand how it would leave a bad taste in the mouths of both white and non-white Labor voters for the party to give inspiring rhetoric about the importance of diversity & inclusion on the one hand….while on the other overriding the local branches’ preference for a non-white candidate to instead impose a white, well-established incumbent who’s lost out elsewhere due to backroom party dealing. Anne Aly was right to call out the whole debacle as “a huge failure”. I’d call it a disgrace, myself.
@Sir Henry: The mystery here is that Le only picked up 35.5% of Greens preferences. Many Greens voters are appalled by exactly the kinds of ALP factional shenanigans at play in this case, eager to see a breakdown in the major party duopoly, and happy to throw their weight behind an independently minded local independent so long as that person comes across as relatively sane, especially where the result in their seat is unlikely to change the outcome of the election either way.
Hi William
Thanks very much for this series, I am reading with interest. However, I’m bound to forget all the details as the series unfolds. Would it be possible to sum up at the end with half a dozen dot points (or more if needed) as to what the main findings were? Thanks
Dai le I would classify as a independent liberal.. this explains
Her relatively low margin and poor share of green preferences to to win in what is a Labor seat is of course an achievement .but the underlying Labor lean of Fowler remains I would suggest the votes were not for her but against kk
The heavy swings to the ALP continued out along Windsor Road into Windsor, Richmond and Kurrajong. These areas had largely double digit swings to the ALP. Local factors such as floods and fires, as well as Susan Templeman’s hard work might have been the factor but it would be interesting to know why there were big swings in outer North West Sydney.