The post-budget polling bonanza continues to unfold, our first item of business being the latest fortnightly Essential Research poll courtesy of The Guardian. On voting intention, the poll finds the Coalition primary vote steady on 37%, Labor down one to 36%, the Greens up one to 10%, One Nation up one to 4% and the United Australia Party up one to 3%. A lower undecided rate and a stronger flow of preferences to Labor causes the gap to widen on the pollster’s 2PP+ measure, which has Labor up two to 50% and the Coalition up one to 45%, with 5% undecided.
The poll suggested the budget had received a lukewarm response, with 25% saying it had made them more likely to vote Coalition and 19% less so. Twenty-five per cent said it would be good for them personally, 33% rated that its inducements would make a significant difference to them, and 56% believed the budget’s main purpose was to help the Coalition win the election. The poll was conducted Thursday to Sunday from a sample of 1086 – more comprehensive results will be along with the publication of the full report later today.
UPDATE: Full results here. Also out today is the monthly Resolve Strategic poll from the Age/Herald, showing Labor up three to 38%, the Coalition up one to 34%, the Greens up one to 11%, One Nation down one to 2% and the United Australia Party steady on 3%, and a Roy Morgan poll with Labor leading 57-43, which I’ll cover in a new post overnight.
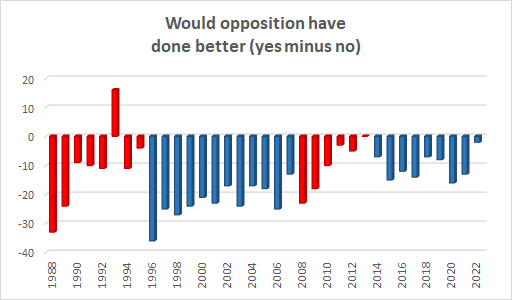
Also out today from The Australian is the regular annual Newspoll results on response to the budget. Here too the results are not as strong as the government might have hoped, the clearest indication of which is the finding that 40% thought the opposition would do a better job with 42% thinking otherwise. As shown in the chart below, this is the weakest result on this question since the Coalition came to power, and the third weakest for any government since the inception of the series all the way back in 1988. While quite a few other results are within its margin of error, all were notably recorded by governments in their last terms before losing office.
The poll nonetheless found that 26% of respondents felt the budget would be good for them personally compared with 25% who thought the opposite and 49% who opted for neither, the net positive rating of 1% being the ninth best result out of the 35. However, the respective results of 33%, 23% and 44% for impact on the economy were relatively poor, with the net positive 10% rating being the worst since the Abbott government’s politically disastrous debut budget in 2014 and the eighth worst overall.
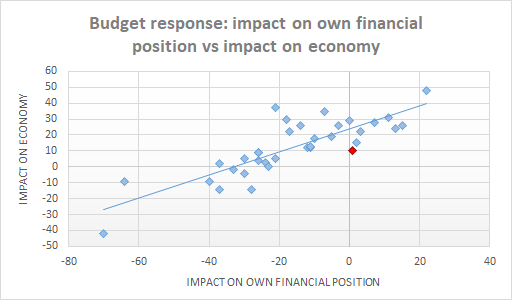
The following chart shows the relationship between the net results on personal and economic impact going back to 1988, with the current budget shown in red. Its position below the trendline is consistent with a budget that was perceived as prioritising votes over the economy – a budget received favourably enough to score a near net zero result on personal impact would typically land at around plus 25% for economic impact, rather than plus 10%.
Also out today courtesy of the Financial Review are state breakdowns from yesterday’s Ipsos poll. Given the poll’s large sample size of 2510, these results are quite robust for New South Wales (sample size 818), Victoria (644) and to some extent Queensland (514). Not much should be read into the results for the smaller states, although I’m actually quite pleased that the paper has gone so far as to provide the results for Tasmania and even the Australian Capital Territory (the Northern Territory is rolled together with South Australia), while making it clear that the error margins in these cases are in the order of 15%.
At the business end, the poll finds Labor leading 53-47 in New South Wales (a swing of around 5% with an error margin of 3.5%), 56-44 in Victoria (swing of 3%, error margin of 4.1%) and 54-46 in Queensland (swing of 12.5%, error margin of 4.4%). From here on, proceed with caution: 54-46 in Western Australia (sample of 251, error margin of 6.5%), 62-38 in South Australia/Northern Territory (sample of 186, error margin of 7.3%), 64-36 in Tasmania (sample of 54, error margin of 14.0%) and 57-43 in the ACT (sample of 43, error margin of 15.3%).