I’m piecing together an article on opinion poll performance at the federal election for Crikey, to which this post is intended as a sort of appendix (UPDATE: And here it is ($)). So far as national polling is concerned, this accounting from ReachTEL speaks for itself, as the primary vote percentages have hardly budged in the week-and-a-half since it was published. The one big outstanding issue is that we don’t yet have a reliable national two-party preferred total, as there are 14 electorates where preferences haven’t been counted on a Labor-versus-Coalition basis. My back-of-envelope reading is that the final result will be about 50.5-49.5 in favour of the Coalition, and it’s on this basis that I’m proceeding here.
The thrust of the Crikey article is that seat polling did not perform terribly well, and that it failed in an interestingly consistent way that you’ll have to read Crikey to learn more about (UPDATE: Did I mention that it was here?. I’m aware of 81 seat polls conducted over the course of the campaign, of which 62 were conducted for media outlets and 19 were conducted privately (excluding a few for which results were not provided with sufficient detail). The following table records the polls’ average biases, which refers simply to the difference between poll results for a given party and the election results and does not imply anything sinister, and errors, which do the same in absolute terms without being concerned with whom the error favoured. For consistency of comparison, this accounting excludes 12 polls that were not Labor-versus-Coalition contests, which you can learn more about at the bottom of the post.

A look at the two-party bias measures might suggest that ReachTEL outperformed Galaxy (which in this table is taken to include the polls it conducted as Newspoll), but I’m inclined to give Galaxy the honours because ReachTEL polls tended to have two errors that cancelled out: an understatement of the Labor primary vote, and an overstatement of the minor party and independent preference flow to Labor. ReachTEL’s headline figures were from respondent-allocated preferences, whereas Galaxy’s were based on preference flows from the 2013 election (which at a national level understated the preferences flow to Labor this time – the jury is still out on which of the two methods produced the smaller errors).
ReachTEL’s success in pitching its electorate polls to private clients resulted in a large amount of detailed private polling emerging in the media, which is not something we have seen much of in Australia in the past. The 19 such polls identified here were, remarkably enough, nearly all conducted for left-of-centre concerns, namely trade unions and GetUp! There is some evidence of selection bias here, by which those commissioning the polls are more likely to publicise the results if they find them to their liking. The two-party bias for the private polls leans in the other direction from the media polls, and while the private polls are recorded as landing slightly nearer the mark, the gap would have closed had I not excluded a poll commissioned by Labor’s candidate in Wentworth that wrongly picked a 10% swing against Malcolm Turnbull, on the basis of insufficient detail was published.
The chart below offers another view of the waywardness of the seat polls, with the spread of biases in the two-party preferred results illustrated by the blue histogram – so for example, 16% (11 out of 69) came in between 0% and 1% too high for the Coalition. This is overlaid by a blue distribution curve that best approximates the spread of the results in the histogram, and a thick black curve that shows how the curve would have looked if the polls behaved as they should have, taking into account a 4% margin of error associated with polls with a sample of 600. The flatness of the blue curve relative to the black one illustrates the point that seat polls behaved is if they had a margin of error more like 7% than 4%, and its right-of-centre placement illustrates a statistically significant 1.3% bias to the Coalition.

When the same exercise is conducted across the national polling, from which we have a rather more limited sample of 33 polls, there is a strikingly different result. This time the black curve shows how we would expect a distribution to look for polls with a margin of error of 2.5%, associated with a sample size of around 1500, which is about what you get these days from Newspoll/Galaxy and Ipsos in particular. The histogram illustrates that Coalition two-party results were all between 48.5% and 51.5%, which is to say that the errors covered a very narrow range from -3% to 1%. The blue curve, being taller than narrower than the black one, tells us the range is narrower than you would expect given the margin of error, with the polls behaving more like they had a margins of error of 2% than 2.5%, and samples of 2400. This time the bias is slightly in favour of Labor, at 0.9%, but this can partly be accounted for by the fact that many of the polls were conducted early in the campaign period, and there appeared to be slight movement to the Coalition over the full course of the campaign.
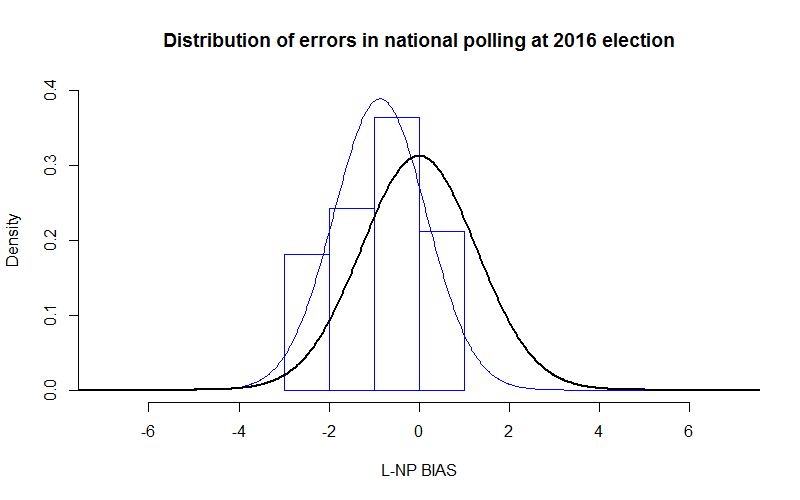
That the pollsters should outperform the theoretical expectation is quite remarkable, given sampling error is the only kind of error the theory acknowledges, and we would expect further issues to arise from different polling methods and rising non-response rates. This raises a suspicion that we are witnessing the herding effects that so blighted polling in Britain before the general election there last May, at which support for the Conservatives was uniformly measured at 6% below the actual result. If so, the very big difference in Australia is that the pollsters have herded at the right place.
Finally, a listing of the 12 seat polls that didn’t fit the Labor-versus-Coalition metric, and were thus excluded from the table above. Note that “OTH” refers to the main non-major candidate, rather than the combined vote for parties other than the Coalition, Labor and the Greens. The only comments I’ll add are that essentially none of them did well at predicting the Coalition vote, and the two Denison polls were even more skewed to the Liberals than the others in Tasmania, but with errors at the expense of Andrew Wilkie rather than Labor.

Can we please leave this thread for discussion of opinion poll performance. The main thread is still here:
https://blogs.crikey.com.au/pollbludger/2016/07/19/essential-research-51-49-labor-9-3/
The results of specific seat polls seem to me to be just what we should expect. It’s difficult to get properly randomised samples drawn from populations of around 100,000 (a typical enrolment in a federal electorate). This in itself introduces inaccuracies into such polling.
As well, campaigning in marginal seats is not at all random. It is very highly targeted. That is, the voter cohorts that are the subject of intense campaigning could be much smaller – say, as few as 20,000-25,000 – in a given marginal. Pollsters most likely do not know who these cohorts are. But even if they did, surveying them would still require properly randomised and relatively large sample sizes – samples that are really just not able to be taken with much confidence.
For example, in the seat where I campaigned, effort was focused in districts with a total enrolment of about 15,000 voters. The purpose of the campaigning was to swing votes. This worked. Significant swings – 10-12% – were recorded in the election among these voters. But such swings would almost certainly not have been detected in a seat-wide poll and still less in a national poll.
To accurately track opinion in individual seats requires quite different techniques to the large-population, fully-randomised survey methods used by the national pollsters.
I think the good polls also herded to the right result in the Victorian state election. An endless run of 52:48 polls and that was the result.
I’ll be posting my review of polling when every vote is in. My hypothesis regarding the seat poll issues has been that the public seat polls – at least of the Galaxy/Newspoll variety – expected too uniform a swing.
There was also article in The Oz on 4 July re poll performance. Paywalled, so you’ll need to google the title & click through if you don’t subscribe.
“Federal election 2016: Newspoll closest to the mark on count” http://www.theaustralian.com.au/business/media/opinion/federal-election-2016-newspoll-closest-to-the-mark-on-count/news-story/ca61b072ff42df1e6cd56c2e07a81264
kevin bonham @ #3 Monday, July 25, 2016 at 1:56 pm
The expectation of uniform swings contradicts all experience. Swings are invariably a patchwork, both between and within seats. There is likely no such thing as a demographically or politically homogenous seat so we should not expect homogenous dynamics, no matter how much we might want them
I think it is a bit hard to evaluate how well the polls performed, as there is a temporal factor to take into account. For example, the individual seat polling might have been accurate at the time it was taken (i.e., one month before the election was held), but as the campaigns progressed, people changed their minds/vote; especially considering that parties often react to these polls (i.e., Libs throwing a lot more resources at Higgins after the poll came out, etc). Also, another issue is that many people voted early, making voting trends problematic.