It has been observed that discussion of Brexit, a matter kind-of-but-not-exactly within the ambit of this site, is taking up a disruptive amount of space on the main threads. Even if this isn’t truly the case at present, it seems to be that it will be soon enough at the rate things are going. So with that in mind, here is a thread dedicated to discussion of the mother country’s ongoing political crisis.
Category: British politics
UK local elections deliver flat result
In the first major electoral test in the UK since Labour stormed back to cost the Conservatives their majority in June 2017, the major parties were tied. Guest post by Adrian Beaumont.
Guest post by Adrian Beaumont, whose work you may be familiar with from The Conversation. Adrian who will be dropping by from time to time to provide commentary on elections internationally.
At the June 2017 UK general election, a dramatic late poll surge to Labour cost the Conservatives their Commons majority. Local government elections held on Thursday were the first major UK election since then. Every May, UK local government elections are held, but particular council wards are usually contested every four years. Thus, the wards up for election last Thursday were last contested in 2014.
This year, all 150 councils that held elections were in England; there were no local elections in Scotland, Wales or Northern Ireland. About 40% of councillors up for election were in London. London’s boroughs held elections for all their seats, while most other councils held elections for one-third of their seats.
The most important result from the local elections is the national projected vote share. This is an estimate of vote share the various parties would have won if local elections were held all over the UK, as in a general election. In 2014, when these seats were last contested, Labour had a projected vote share of 31%, the Conservatives 29%, the UK Independence Party (UKIP) 17% and the Liberal Democrats 13%.
At the May 2017 local elections, the Conservatives thumped Labour 38% to 27% with 18% for the Liberal Democrats. These elections were held before Labour’s surge began. At the June 2017 general election, the Conservatives beat Labour by just 42.4% to 40.0% in popular votes.
This year, the BBC’s projected national vote share gives the Conservatives and Labour 35% each, with 16% for the Liberal Democrats. This represents a 1% two party swing to the Conservatives since 2014, but a 1% swing to Labour from the 2017 general election. Opposition parties have usually performed better in local elections than general elections, so this result is disappointing for Labour.
National polls currently have the Conservatives a few points ahead of Labour, so the local elections are consistent with that polling. The Liberal Democrats, who historically do better at local than general elections, have less than 10% in national polls, but won 16% in the local elections.
Labour won 2,310 councillors (up 59 since 2014), the Conservatives 1,330 (down 31), the Liberal Democrats 536 (up 75) and the Greens 39 (up eight). The biggest loser was UKIP, which won just three councillors (down 123). Most wards contested this year were in Labour-favouring areas.
British election live
Live commentary of the British election count.
Conclusion. I kind of lost interest in live blogging after the previous post, but nearly 24 hours on from the closure of polling, only one seat remains to be declared, and the result if Conservatives 318 (-12), Labour 261 (+29), Scottish Nationalists 35 (-21), Liberal Democrats 12 (+4), Plaid Cymru 4 (+1), Green 1 (-) and, of the Northern Ireland contingent, Democratic Unionist 10 (+2), Sinn Fein 7 (+3) and independent 1 (-). The seat that remains to be called is the normally blue-ribbon constituency of Kensington in London, which is on to its third recount after going down to the wire as a result of the metropolitan backlash against the Conservatives. The first two counts reportedly had Labour winning by 36 and 39 votes. As Sinn Fein members don’t take their seats, the magic number is 322, and the Conservatives will be relying on the Democratic Unionist Party to reach it. Three parties represented in the previous parliament have emerged empty-handed: Northern Ireland’s Social Democratic & Labour Party and Ulster Unionist Party, who won three and two seats in 2015, and UKIP, who won one.
Excluding Kensington, the vote shares are Conservative 42.4% (+5.5%), Labour 40.0% (+9.5%) and Liberal Democrats 7.4% (-0.5%). Line honours among the pollsters clearly go to Survation, whose final poll had it at Conservatives 41.3%, Labour 40.4% and Liberal Democrats 7.8%, which was the narrowest Conservative lead out of the nine pollsters on the British Polling Council. YouGov seemed to have it right earlier, but squibbed it with a late methodology change that herded to the Conservatives, their feelings presumably hurt by this sort of thing. The overall bias of the BPC pollsters to the Conservatives most likely reflected a reluctance to believe the age profile of the voting population would be much different from 2015, whereas Survation were more inclined to take respondents at their word as to whether they would vote. Outside the BPC tent, SurveyMonkey did better than all but one of those within in recording a 42-38 lead to the Conservatives; and Qriously’s 4% error, in this case in favour of Labour, was bettered only by Survation and Kantar.
UPDATE: Mike Smithson of Political Betting points out that the polling figures exclude Northern Ireland, whereas the numbers quoted above do not, and hence dampen the results for all concerned. The proper base from which the pollsters should be judged is Conservative 43.5%, Labour 41.0%, Liberal Democrats 7.6%.
Once again, the exit poll overseen Professor John Curtice more than earned its keep, coming in at 41% apiece for the Conservatives and Labour, and projecting 314 seats for the Conservatives, 266 for Labour, 34 for the Scottish Nationalists and 14 for the Liberal Democrats. Immediate reaction to the exit poll in 2010, 2015 and 2017 was that it surely must be underestimating, respectively, the Liberal Democrats, Labour and Conservatives, but each time it came up smiling.
4.36am. After all the hype, Amber Rudd hangs on in Hastings & Rye.
4.23am. Plymouth, Sutton & Devonport now a declared Labour gain from the Conservatives, overturning a 1.1% margin.
4.20am. Alex Salmond loses his seat of Gordon to the Conservatives, in another blow to the SNP.
3.57am. Northern Ireland’s Labour-aligned party has now lost all of its three seats.
3.50am. Lineball result in Amber Rudd’s seat of Hastings leads to recount.
3.37am. Kingston on the fringe of London adds to scattered Liberal Democrats gains around the place from the Conservatives.
3.31am. Someone on BBC says projections point to 3% Conservative lead on the vote, suggesting Survation probably the best performing pollster.
3.29am. Eastbourne another Liberal Democrats gain from the Conservatives.
3.17am. BBC analyst says Labour boilover now expected in Kent seat of Canterbury, with a surge of young voters apparently set to overturn 18.3% Conservative margin. Labour has also gained the Midlands seat of Peterborough (4.1% margin) in a squeaker. In other close result news, the SNP have seen off the Conservatives by 21 votes in Perth & North Perthshire, against the prediction of the exit poll.
3.02am. Labour’s surprise win in the Suffolk seat of Ipswich, mooted earlier in the night, is now confirmed. But in Northern Ireland, the Labour-aligned Social Democratic and Labour Party has lost two of its three seats — one to Sinn Fein, one to the Unionists.
2.59am. Now eight confirmed losses for the SNP: four to the Conservatives, three to Labour, one to the Liberal Democrats. The BBC is projecting them to drop from 56 seats out of 59 to 32.
2.57am. Bristol North West a non-London Labour gain from the Conservatives.
2.54am. Knife-edge Conservative seat of Gower in Wales goes to Labour, not unpredictably. London seat of Twickenham goes from Conservative to the Liberal Democrats, presumably the beneficiary of heavy duty tactical voting.
2.46am. Labour gains Sheffield Hallam from former Liberal Democrats leader Nick Clegg, rated a 33% chance by the exit poll.
2.42am. SNP casualty list lengthens with Liberal Democrat gain of Dunbartonshire East, which was anticipated by the exit poll.
2.38am. Better news for the Conservatives from Southport in north-western England, which they have gained from the Libeal Democrats, which the exit poll rated only a 10% possibility.
2.27am. Midlothian now goes from SNP to Labour, against the prediction of the exit poll.
2.25am. Conservatives win Ochil & Perthshire South, of which exit poll said this: “the Conservatives have a 31% chance of victory, Labour has a 23% chance of victory, the SNP has a 46% chance of victory”. So SNP fairly consistently under-performing the exit poll.
2.19am. Conservatives gain Moray from SNP, as anticipated by exit poll.
2.16am. Conservative ministers confident no more of the exit poll being wrong.
2.11am. Another double-digit swing in London turns the marginal Labour seat of Ealing into a safe one.
2.06am. Stockton South, rated as lineball by the exit poll, goes to Labour.
2.02am. Labour win confirmed in Battersea with 10% swing.
1.58am. Conservatives gain Scottish seat of Angus from SNP — picked by exit poll, but talked up as a shock by the BBC presenter.
1.45am. Another double digit swing to Labour in London, this time in the Conservative seat of Putney. Keep in mind that swings are calculated differently in British parlance, such that a 10% swing overturns a 20% margin. So these results are consistent with Labour being competitive or better in Battersea (15.6%) or even Kensington (21.1%), both the subject of excited Labour chatter.
1.41am. Labour gains Welsh margin Vale of Clwyd with swing of 3.5%.
1.35am. Exit poll looking better now — talk even that Labour will outperform it.
1.30am. Young SNP firebrand Mhairi Black retains Paisley & Renfrewshire South.
1.25am. First result from London is Labour-held Tooting, where Labour gets a swing of 10.6%.
1.20am. The Rutherglen gain by Labour from the SNP was not predicted by the exit poll, which had Edinburgh North & Leith as their only gain in Scotland. BBC pundit says Labour expects to win Sheffield Hallam from former Liberal Democrats leader Nick Clegg — this was too close to call in the exit poll. Other two mooted Labour gains she mentions were anticipated by poll.
1.13am. 4.5% swing to Labour in their safe Welsh seat of Llanelli; Labour narrowly gains Rutherglen & Hamilton West from SNP, the first declared result to change hands.
1.11am. Labour now expecting to make gains in Wales, after disappointing Conservatives failure in Wrexham.
12.59am. I belatedly observe a 1.4% Conservative swing in the north-west England seat of Workington. Someone earlier said the picture got better for the Conservatives with every foot you travelled north.
12.53am. Status quo result in Labour-held north-eastern seat of Durham, where the Conservatives might have vaguely hoped they could still gain based on early results from the region, although 7.7% margin made it a big ask. Still, the sort of seat the Conservatives were expecting to win going into the election.
12.38am. 2.2% swing to Labour in Broxbourne and 0.2% swing in Nuneaton, two middle England seats. But mounting talk of a big result for Labour in London, including a win in Battersea, margin 15.6%.
12.32am. “Entirely possible we will still get an overall majority”, is the less-than-bullish assessment of Conservative heavyweight Liam Fox.
12.28am. 2.6% swing to Labour in Kettering, a Conservative seat in the Midlands.
12.25am. BBC pundit says Labour said to be confident of the Suffolk seat of Ipswich, margin of 7.7%, and four gains in Scotland.
12.21am. Newcastle North swings 0.5% to Labour, which is better than their regional form.
12.16am. Specifically, HuffPost UK politics editor Paul Waugh says Labour is expected to win Kensington, which the Conservatives won 52.2% to 31.1% in 2015.
12.08am. Washginton and Sunderland West swings 2.2% to Conservatives, in line with regional trend. However, there’s excited talk on Twitter about Labour’s prospects in blue-ribbon constituencies in London.
11.59pm. Bad result for Labour from Newcastle Central, good one from North Swindon. Long night ahead.
11.47pm. Third seat is Sunderland South: 2.2% swing to Conservatives. BBC analyst indicates Labour worried exit poll wrong because Conservatives outperforming it on postal votes.
11.33pm. BBC reporter says Labour remain excited about Hastings and Rye, held by Home Secretary Amber Rudd on a margin of 9.4%, which wasn’t picked as a Labour gain by the exit poll. It was a middlingly good seat for UKIP in 2015, and a bit above average for age.
11.23pm. Exit poll broken down by age: 63-27 to Labour among 18-34; 43-43 among 35-54; 59-23 to Conservative among 55+.
11.20pm. Conservative sources expressing confidence the exit poll is wrong. But as Antony Green points out, the picture in the two constituencies that are in is complicated by the steep decline there of UKIP.
11.08pm. A second pro-Brexit Labour-held constituency, Houghton and Sunderland South, has the Conservatives outperforming the exit poll, with a 2% swing in their favour.
11.03pm. First result, from Newcastle upon Tyne Central, records 2% swing to Labour, which is less than the exit poll anticipated.
10.21pm. Britain Elects on Twitter: “Amber Rudd in trouble in Hastings & Rye (2015 Con +9), so says the BBC.”
10.19pm. Markets respond.
10.11pm. Labour MP John McDonnell “sounds rather doubtful that the exit poll is right”, at least in the view of Lord Ashcroft.
10.08pm. Antony Green points out the feted exit poll from 215 in fact under-predicted the Conservatives by 15 seats.
10.04pm. Another British election, another stimulating exit poll result. Conservatives to lose majority with 314 seats (326 required for majority) to 266 for Labour, 34 for Scottish Nationalists and 14 for the Liberal Democrats.
9.56pm. The Sun’s political editor on Twitter: “Scotland now looking really good for Tories, I’m told 10-12 gains from the SNP possible”.
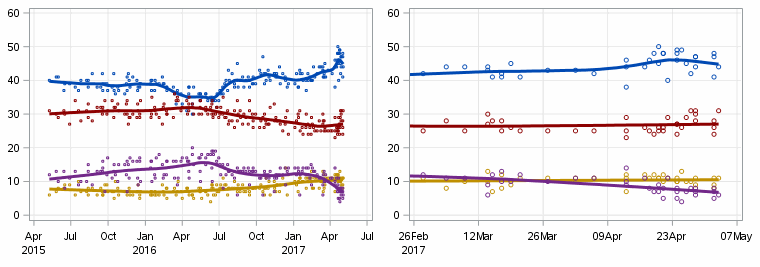
9.55pm GMT. The final reading of the BludgerTrack UK poll aggregate: Conservative 43.0, Labour 36.8, Liberal Democrats 7.6, UKIP 4.2. Coming soon: the moment of high drama that is the announcement of the exit poll.
BludgerTrack UK: CON 43.0, LAB 38.0, LD 7.4, UKIP 4.1
Analysis of British election polling, and lots of of it.
With four days left to go, my trend measure of British opinion polls finds the gap continuing to narrow, with the Conservatives down 0.9% since last week to 43.0%, Labour up 2.6% to 38.0%, the Liberal Democrats down 0.5% to 7.4%, and Ukip up 0.1% to 4.1%. The Conservative lead of 5.0% is 1.5% less than the 2015 result, a swing that would give Labour a net gain of 10 seats from the Conservatives in England and Wales if uniform.
Then there’s Scotland, where a separately conducted poll trend calculation produces results of Scottish National Party 42.7% (down 7.3% on the 2015 election), Conservative 27.2% (up 12.3%), Labour 19.3% (down 5.0%) and Liberal Democrats 5.8% (down 1.7%). However, the error bars here are rather wide — most of the data points are small sample breakdowns from national polls, with the most recent Scotland-specific poll, from Ipsos-MORI a week ago, having Labour and the Conservatives level on 25%. For what it’s worth though, crudely applying these swings to the 2015 vote shares results in the SNP dropping eight of their 56 seats, with seven going to the Conservatives and one to the Liberal Democrats.
All told, that suggests a result of 327 seats for the Conservatives, down from 330 at the 2015 election, and 242 for Labour, up from 232, out of a total of 650 — assuming no change to the Liberal Democrats’ seven seats in England and Wales, and making no effort to account for the 18 seats in Northern Ireland.
As I discusssed at length in Crikey on Friday, the more interesting story to emerge from the polling is the disparity between voting intention of younger and older respondents, such that pollsters’ findings are heavily dependent on the relative weightings they apply to them. This is demonstrated in the chart below, which records Labour’s gain among respondents aged 18-34 has been twice as great at among those aged 55 and over, from a base that was already remarkably wide to start off with.
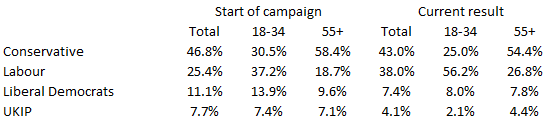
Age loomed large in the polling industry’s failure at the 2015 election, with Anthony Wells of YouGov and UK Polling Report observing that the single biggest issue was that pollsters surveyed “too many younger people who were too engaged and too interested in politics”. Broadly speaking, one of the approaches to dealing with this issue has been to construct turnout models based more on the age and class structure of the voting population at the 2015 election, as recorded by post-election surveys — and it is these pollsters who have recorded the strongest results for the Conservatives.
ComRes, ICM and Kantar have followed this pattern throughout the campaign, while Panelbase has done so since a methodology change that has applied to the latest two out of their six campaign polls. The effect in each case has been to downweight younger respondents, and hence support for Labour. If Labour’s hope of a turnout surge among younger voters is borne out, these polls will no doubt be found wanting.
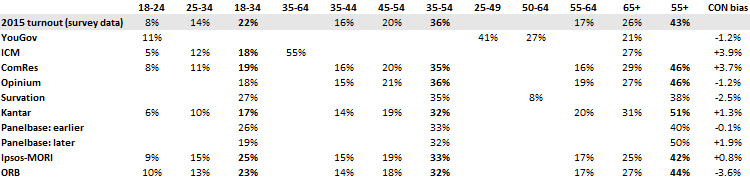
Indeed, various other methodological adjustments by these pollsters appear to be producing a turnout population that is somewhat older than that in 2015 (see table below). In the case of ICM, which is weighting by self-identified political interest levels, one recent poll was calculated by Wells as producing a Conservative lead eight points greater than would have been the case using the pollsters’ 2015 models.
Survation, which famously produced an accurate result on the eve of the 2015 election but shied away from publishing it, has not made any radical changes to its methodology, which continues to rely heavily on self-identification for turnout. Its age structure has varied considerably from poll to poll, but overall it has projected stronger turnout among the young than in 2015, and has accordingly produced strong results for Labour.
ORB appears to be splitting the difference between self-identification and turnout by age and education as recorded in 2015, and has produced the strongest results of all for Labour — albeit that this is heavily influenced by one outlier result in late April, when it recorded a Conservative lead of a mere 11%, as opposed to the trend measure of 19.6% at that time.
YouGov has received considerable attention for its strong results for Labour late in the campaign, but it has only been since mid-May that any such lean has been evident. This pollster has sought to redress the failings of 2015 by weighting by self-identified political interest level and education qualification, again with the aim of matching their results to post-election surveys. Its age model makes it hard to compare with other pollsters, since it uniquely breaks the middle groupings into 25-49 and 50-64 cohorts. However, its modelled turnout population looks more like the population at large than turnout in 2015.
Another big-name pollster, Ipsos MORI, has persisted with weighting by self-identified likelihood of voting, and accordingly has a young turnout model as compared with the 2015 election. However, this has not translated into particularly strong results for Labour, albeit that it has only published three results in the course of the campaign. The pollster has sought to address the industry-wide problem with over-representing the heavily engaged by weighting by education and newspaper readership, and using a range of indicators to exclude potential non-voters.
Opinium has been an odd man out in that its age breakdowns resemble those of ComRes, ICM and Kantar, but it has not produced correspondingly strong results for the Conservatives. Whereas the latter pollsters have purposefully weighted to a specific age model, Opinium appears to have achieved a similar effect through weighting to reported vote in 2015.
For further illumination on these matters, the following table shows how much weight each pollster has given to its various age cohorts, using averages of their polling over the campaign period. The final column is an averaged measure of how much the pollsters’ recorded Conservative leads have differed from the trend measure.
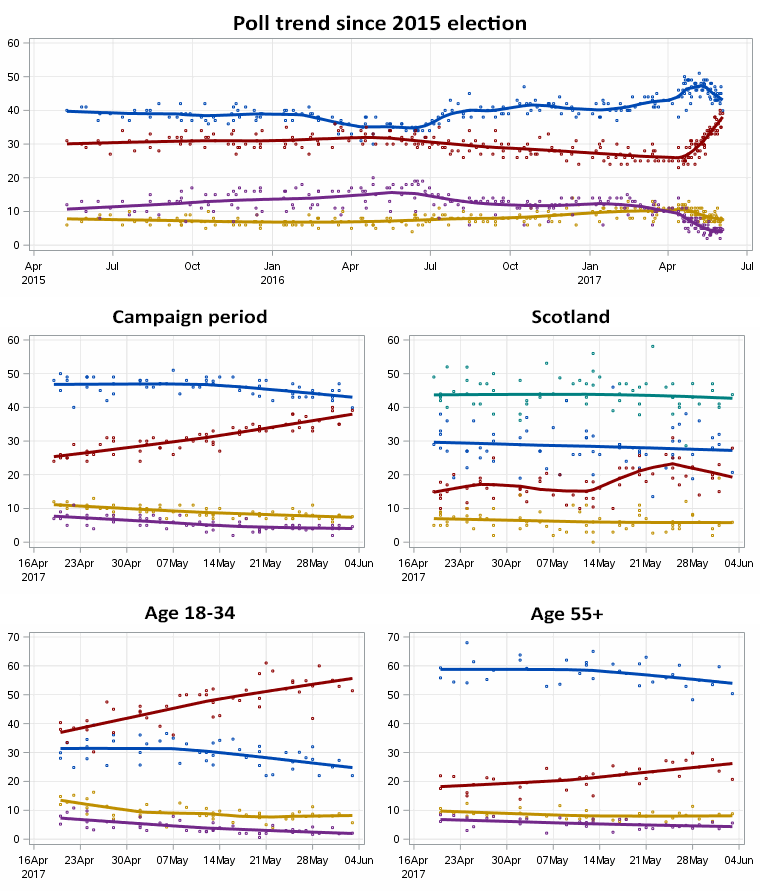
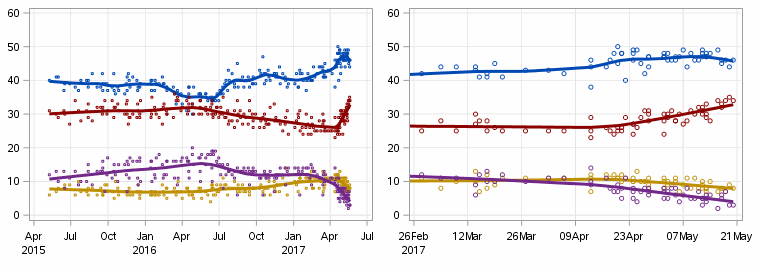
And finally, self-explanatory trend charts with the Conservatives shown as blue, Labour as red, Ukip as purple, the Liberal Democrats as gold, and the Scottish Nationalist Party as teal.
BludgerTrack UK: CON 43.9, LAB 35.4, LD 7.9
Latest update from a country where the polls are actually doing something.
With ten days left before the general election, Labour’s recovery in Britain, at least as measured by the polls, has reached an extent sufficient to cause the Conservatives real alarm. Since I last conducted this exercise a week ago, the Conservatives have dropped another 1.8% to hit 43.9%, while Labour is up 2.6% to 35.4%. This leaves both parties well up on their totals at the 2015 election, which were 36.9% and 30.4% respectively. The Liberal Democrats are at 7.9%, which is unchanged on both last week’s reading and their disastrous 2015 election result, while 4.0% is all that remains of Ukip, who polled 12.7% in 2015 and hit a peak of 15.6% on the poll aggregate a month before the Brexit referendum in June last year.
BludgerTrack UK: CON 45.7, LAB 32.8, LD 7.9
British polls continue to point to a Conservative landslide, while showing signs of life for Labour, and a weakening position for the minor parties (at least in England).
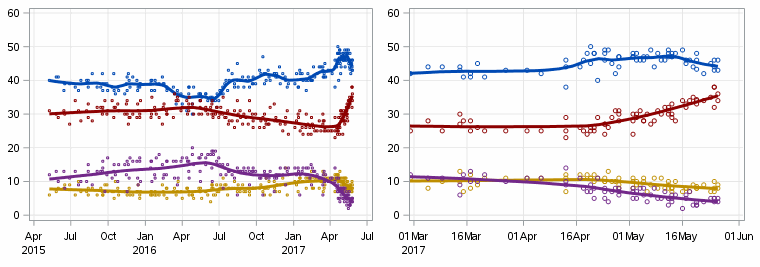
With two-and-a-half weeks to go, I’m going to start posting poll aggregates ahead of the June 8 British general election with a regularity yet to be determined. There’s no clever business going on here in terms of weighting and bias adjustment – the results are simply what SAS/STAT’s LOESS function spits out when I plug in all the polling since the 2015 election as harvested from UK Polling Report, using the optimal smoothing parameters it determines through means beyond my pay grade.
The story of the campaign period specifically is that voters have been returning to the major parties, with UKIP suffering particularly badly, to the extent that they are back to looking as “minor” as the Greens. The Liberal Democrats are by no means exempt, despite seemingly having a monopoly on the pro-Europe market. The first of the charts below covers the full course of the current term, while the second zooms in on the period going back to the start of March. Apparent on the second chart but not the first is that the Conservatives have not maintained their early campaign momentum, whereas Labour is undergoing an impressive recovery, albeit from an abysmally low base.
I see England, I see France: part deux
The results of looming elections in France and Britain are looking less in doubt than ever.
Update
4.00am. The sampled count result is in: Macron 65.1%, Le Pen 34.9%.
3.15am. Actually, what will be published at 4am will be the sampled early count of actual voting, which proved pinpoint accurate last time. Exit polls are coming out now, and have Macron at around 63%.
2.15am. I’m giving this a bump in case anyone’s about who wishes to discuss tonight’s results from France. Exit polls will be out at 4am.
Earlier:
We’re now two days away from the run-off election for the French presidency, and a bit under five weeks away from the general election in Britain. A ban on polling in the final days of French election kicks in around about now, and they suggest that centrist contender Emmanuel Macron’s 60-40 lead over far right candidate Marine Le Pen as of a week ago has widened a little as the big day approaches. The polls were eye-wateringly consistent and accurate ahead of the first round election, and have remained so on the former count at least.
Britain had a dry run with yesterday’s council elections, the results of which poured cold water on any notion that the polls might be as badly astray this time as they were in 2015. In other words, they delivered unprecedented victories for the Conservatives and unmitigated disaster for Labour, as well as reinforcing the impression of a mass exodus from Ukip to the Tories. The poll aggregate below, conducted without any clever-dickery in relation to weighting and bias adjustment, records the Conservatives at 44.8% (compared with 36.9% in 2015), Labour at 28.3% (30.4%), the Liberal Democrats at 10.5% (7.9%) and Ukip at 6.8% (12.6%).
The first chart goes back to the last election, the second to the beginning of March. Among the things the latter makes clearer is that a spike to the Conservatives after the election was announced has in fact levelled off, and that some vaguely encouraging results for Labour a week or so ago haven’t been maintained.
I see England, I see France
An overview and thread for discussion of looming national elections in the United Kingdom and France.
UPDATE: Exit polls from France will be published 4am EST (i.e. early Monday morning), and the actual result should be clear about three hours after that, unless it’s particularly close.
There’s a lot of big election news going down right now at the other side of the globe, starting with the first round of France’s presidential elections on Sunday, to be followed a fortnight later by a run-off between the two leading candidates.
Recent polling indicates the two leading candidates are Marine Le Pen of the far right National Front and Emmanuel Macron, a former Socialist running under his own banner. However, polling hasn’t had a great record in Europe lately, and Nate Silver of FiveThirtyEight has pointed to a suspiciously narrow range of recent French presidential results, which has been known to signify that pollsters are “herding” each other off the end of a cliff. This leaves at least some hope for François Fillon of the centre-right Republicans, whose initially promising campaign has been hobbled by personal scandals. A hard left candidate, Jean-Luc Mélenchon, has gained a head of steam over the past month, although his recorded support has recently tapered off at a level below where he needs to be. Head-to-head polling suggests Le Pen would be heavily defeated in the run-off, particularly if facing Macron.
It also emerged on Tuesday that Britain will go to the polls on June 8, for an election that looms as an historic disaster for Labour. The Conservatives’ unexpected majority victory at the May 2015 election was achieved from 36.9% of the national vote, which netted them 330 seats out of 650, compared with 30.4% and 232 seats for Labour. Recent polling has mostly had it in the low forties, but two polls conducted in the immediate wake of the election announcement had them at 46% (an ICM poll for the Guardian) and 48% (YouGov for The Times). Labour’s recent poll ratings have been anywhere between 23% and 29%, with the most recent results being 24% from YouGov and 26% from ICM. This suggests the Conservatives are in a position to match Labour’s historic landslides under Tony Blair, who won 418 seats in 1997 and 413 in 2001.
Both major parties were up slightly on the primary vote in 2015, but the Conservatives emerged the principal beneficiary of the collapse of the Liberal Democrats. By contrast, Labour was devastated north of the border by the triumph of the Scottish National Party, which won all but three of Scotland’s 59 seats, gaining 40 from Labour and 10 from the Liberal Democrats. The seats remaining to Labour are concentrated in London; Merseyside and Manchester; Leeds and its industrial surrounds; Birmingham; Newcastle and Durham; and south Wales. The rest of England’s electoral map is a sea of blue, punctuated by occasional small islands of red, and still more occasional ones of orange (traditionally associated with the Liberal Democrats).
Each of Labour’s stronghold regions consists of a safe core and a less safe periphery, and it’s the latter areas that are looming as the main battlegrounds of a losing election. To isolate one example, Labour holds 45 seats in the area of Greater London, compared with 27 for the Conservatives and one for the Liberal Democrats. It will continue to dominate the city’s inner east even under worst case scenarios, but will come under pressure in as many as ten seats in the west and on the fringe of the Greater London region.
The polls have generally had the Liberal Democrats at around 11%, representing a modest recovery from the disaster of 2015, when they dropped from 57 seats and 23.1% of the vote to eight seats and 7.9%.
However, opportunities for further gains are limited, and the Conservative tide could even cause the party trouble in the few seats it continues to hold. Ukip yielded only the seat of Clacton from its 12.6% share of the national vote in 2015, and lost that a month ago when Douglas Carswell, a former Conservative MP, quit to sit as an independent. Polls suggest the party has shed support to the Conservatives, so its pickings in the House of Commons look likely to remain slim or non-existent.
The polls I’ve looked at for Scotland suggest the Scottish National Party will retain most if not all of its 50.0% support from 2015, so the party will presumably continue to dominate Scotland’s 59 seats, of which it holds all but three. Any talk of a defeat for the government is being framed in terms of its majority being lost to a “progressive alliance” of Labour, the Scottish National Party and the Liberal Democrats, but at this stage it seems very unlikely it will come to that.