At last, some commentary on the Senate count. Only one of the results is in doubt, with New South Wales, Victoria, Western Australia and South Australia all turning in good old-fashioned results of Coalition three, Labor two and Greens one, Jacqui Lambie snaring a seat in Tasmania at the expense of a third Liberal, and the territories behaving as they always do.
The exception is Queensland, where the third Liberal National Party candidate, the second Labor candidate, and the first candidates of the Greens and One Nation are in a game of musical chairs in which one will miss out when the music stops. In actuality, LNP and One Nation are pretty much home and hosed at this point, so the issue is whether the last seat will go Labor or Greens.
Based on the primary vote, it looks like Labor will miss out, reducing them to a single Senate seat, for which the only precedents are the Western Australia and South Australian results in 2013. Labor has only 0.60 quotas spare after the election of its first candidate, adrift of the LNP on 0.76, One Nation on 0.72 quotas and the Greens on 0.68. Probably the leading authority on the count is Ross Leedham on Twitter, who it appears expects Labor to narrow the primary vote gap a little on late counting, and then to take it up to the Greens with preferences.
To get a sense of how preferences are likely to behave, I have wrangled with the data file from the 2016 election, to produce “four-party preferred” measures for the various minors and micros who will be excluded from the count. This only uses above-the-line votes, and uses Australian Liberty Alliance preferences for Fraser Anning’s party, Family First’s for Australian Conservatives, the Renewable Energy Party’s for two micros with “climate” in their names, and the Health Australia Party for an anti-vaxxer party. Some very small parties that couldn’t be matched are ignored.
With these results used to project the preferences of the small parties, the Greens’ lead over Labor extends slightly, from 1.1% to 1.3%. This is somewhat contrary to the assessment of Kevin Bonham, who used preference guesstimates to conclude Labor would close the gap but not by enough. These estimates look like they might be on the high side for Labor, and I have further credited the Greens with some fairly heavy duty preference flows from micro-party minnows Bonham hasn’t bothered with.

Two complications arise from the United Australia Party, which will be the last party excluded before the conclusion. One is their how-to-vote card, which recommended a second preference to the LNP and a lower order preference to Labor. This renders unreliable the projection I have extrapolated from the tiny Palmer United Party vote in 2016, which gives One Nation too many Palmer preferences and the LNP too few. However, I’m projecting both to do well enough to win seats in any case.
The other is the possibility raised by Kevin Bonham that either the LNP or One Nation will make a quota before the UAP is excluded. If the former, UAP votes following the how-to-vote card will end up with Labor instead of the LNP, potentially making them competitive in the race against the Greens. However, I’m projecting the LNP to be fairly well short of a 14.3% quota with 13.0% at the point where the UAP are excluded, with One Nation also just shy at 14.0%.
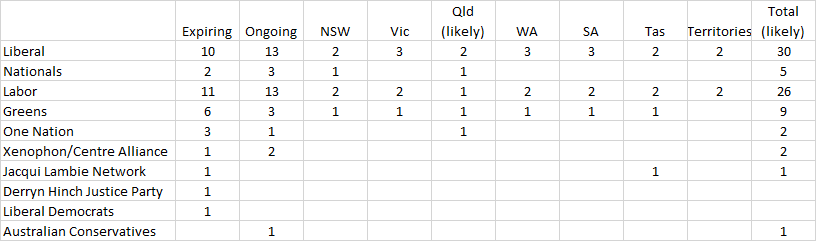
With all that in mind, I’m going to work on the basis of a result of Coalition three and one seat each for Labor, One Nation and the Greens in offering the following summary of the state of the Senate post-election.
New South Wales. With the Coalition on 2.72 quotas, Labor on 2.11 and the Greens on 0.60, the result here looks sure to be three, two and one seats respectively, unless One Nation on 0.35 quotas can do something astounding on preferences. Jim Molan has clearly failed in his bid to have below-the-line votes overturn his demotion on the Senate ticket – he appears to be getting about 80% of the below-the-line votes, which could be generously estimated to account for 10% of the total. That would leave him with about 3% of the vote, or 0.2 quotas, to take on Nationals candidate Perin Davey, who will have the 0.7 or so quota surplus left after the election of the second Liberal.
Victoria. Very similarly to New South Wales, the Coalition are on 2.54 quotas, Labor on 2.23 and the Greens on 0.70, guaranteeing a result of three, two and one. Way behind the Greens on 0.20 quotas apiece are Derryn Hinch’s Justice Party and One Nation. Hinch’s failure is something of a surprise, his 2.8% vote share being well below the 3.7% recorded by his party at the state election last November. Presumably the 2.5% United Australia Party vote, modest as it was, came largely at his expense.
Western Australia. A clean result of Liberal three (2.93 quotas), Labor two (1.96 quotas) and Greens one (0.82 quotas). One Nation polled a reasonably solid 5.5%, but not nearly as well as the Greens, who recorded an insurmountable 11.7%.
South Australia. Three Liberal (2.63 quotas), two Labor (2.16) and one Greens (0.78), with One Nation too far behind the pace on 0.32.
Tasmania. Two Liberal (2.21 quotas), two Labor (2.17 quotas), one Greens (0.88) and one Jacqui Lambie (0.61).
As usual, thanks for the detailed and clear analysis.
Facts matter more than ever now as we try and find our way through “the ever-changing world in which we live in”.
There is not much joy for the progressive movement in the EU. Elections. Note that this is from exit polls only. Results cannot be realeased until voting closes at 2300 German time (2200 British summer time).
I blame Scandinavia. They must be waiting for sunset!
Unfortunately the march of the far right continues, with only a few bright spots in places . Alternative fur Deutchland do not seem to have made many gains.
The Greens have done well in Germany, doubling their vote to 22%. On the downside that vote seems to have largely from collapse of the SPD – the social democrats. So, it probably means that the progressives may as a whole may have gone backwards.
However, as the Guardian says, exit polls come with the usual health warnings
The spreadsheet graphic at the end of the post has WA and SA with 3 Liberal, 2 National, 1 Labour. Probably worth fixing!
Message from rural Qld: we really are a self interested, village idiot, racist, under educated, denialist mob out here. Example : when I asked my local member his opinion on the scientific climate change theory, he replied by babbling some incoherent tosh about dinosaurs and 65 million years of variable weather. When our MP’s are as stupid as this what chance is there with the ordinary people. Labor has only one senator in Qld. Malcolm Roberts is a senator- get me out of here.
That final table doesn’t seem to add up? 41 senate seats to the coalition, WA, SA and TAS won for Nationals doesn’t look right.
Great analysis, I think the table at the bottom though is a little out of whack however. Nationals don’t have 11 seats and Greens won a seat in WA and SA.
William – in that table at the bottom I think you’ve transposed some of the National & Labor & Greens results – I think it would be quite remarkable if the Nationals got 2 seats each in WA, SA and Tas.
Jackal,
I just wasted an inordinate amount of time attempting to make sense out of the Senate tally board which is not in line with the state by state commentaries. Well, it’s early morning here. 🙂
some of the figures in the xls are in the row above where they should be. so Nats getting 2 in SA, WA, Tas rather than in the ALP row.
whoops already been noted
Hi William – thanks for the analysis. Interesting possibility of preference flows. One question though: you write, ‘However, I’m projecting One Nation to be fairly well short of a 14.3% quota with 13.0% at the point where the UAP are excluded, with One Nation also just shy at 14.0%.’ I’m wondering where you are projecting the LNP to be at the exclusion of the UAP?
Great analysis William.
I’ve found very similar on the 4PP-I’d tend to disregard the UAP preference flows in 2016 as being too instructive though but still makes all signs point to the Greens getting over the ALP even if the gap narrows.
Thanks, error checkers – I’ve now given this the thorough proof-reading I should have given it before I published. The error in which some Labor seats are attributed to the Nationals may linger until you do a hard refresh.
Gerry Butler
Yeah those selfish bastard who only care about their family who cares that they have an income so that their wife and kid are fed. How selfish are they to not sacrifice them self and their family for global warming.
Most of these people used to be working class people who voted ALP just look at Queensland and the Hunter valley. If the inner city elitist progressives keep demonising ordinary Australians putting food on the table. These people will never vote the ALP again. In a couple of elections Hunter would be a safe Liberal seat. A seat where the ALP used to have 70% 2pp
Good luck ever winning another election
The ALP versus Nat Margin in Hunter* is still over 60% for the ALP and with better campaigning next time it will probably be more favourable to the ALP.
*Whether or not the Nats stay in the 2CP after the 3CP is still up for question (but will probably still be in Nats favour) and whether PHON would do any better on Nats preferences than the other way around make it almost a photo finish, all be it not in the Senate.