Western Australian upper house: final score

The conclusion of counting for the upper house leaves Labor and the Greens facing an equal number of members from various parties of the right.

The finalisation of the upper house count today has left Labor a seat short of where it would have liked to be, with Labor on 14 and the Greens on four accounting for exactly half the chamber’s 36 numbers. They will amount to a majority on the floor if Labor succeeds in its endeavour to persuade Simon O’Brien, a Liberal, to take the President’s chair. Otherwise, they will need an extra number out of the four Nationals, three One Nation, one Shooters Fishers and Farmers, and one Liberal Democrats. Substantial reform to the Legislative Council, such as would address Labor’s present situation of facing a shaky upper house after a landslide election win, would require nineteen votes on the floor. Featured below is commentary on each result together with links to the full preference distributions, which as yet have not been published on the Electoral Commission site.

Agricultural

1. Martin Aldridge (Nationals); 2. Darren West (Labor); 3. Jim Chown (Liberal); 4. Colin de Grussa (Nationals); 5. Laurie Graham (Labor); 6. Rick Mazza (Shooters).
Click here for preference distribution spreadsheet

There were 88,175 votes in the count and a quota of 12,597. The Nationals started with two quotas, Labor and Liberal with one apiece. The micro-party snowball didn’t amount to much, with the Liberal Democrats going out before the Greens. Labor was then elected with preferences not just from the Greens, but also the Daylight Saving Party, Flux the System and the enigmatic Family First. Presumably this reflected a partial deal with the Glenn Druery bloc, in which the Liberal Democrats and Fluoride Free refused to participate. That left One Nation on 10,777, Shooters on 8,752 and Liberal #2 on 4,241, after which preferences from elected Labor and excluded Liberal went to Shooters, who defeated One Nation at the final count by 13,299 and 10,820. In other words, Liberal preferences could have elected One Nation if they had gone that way, but they actually had them third behind Shooters.

East Metropolitan

1. Alanna Clohesy (Labor); 2. Donna Faragher (Liberal); 3. Samantha Rowe (Labor); 4. Matthew Swinbourn (Labor); 5. Tim Clifford (Greens); 6. Charles Smith (One Nation).
Click here for preference distribution spreadsheet

Labor elected three members from the primary vote, and the Liberals one. The Greens made it to the fifth seat with the Labor surplus and three of the Glenn Druery bloc (Fluoride Free, Daylight Saving and Flux the System). As explained in the previous post, One Nation then proceeded to win the final seat at the expense of the third Liberal due to a distinctive feature of the counting system, which meant that Labor and Greens votes were used up electing the Greens, while Animal Justice votes proceeded unmolested to the final count, at which point they went to One Nation ahead of the Liberals.

Mining and Pastoral

1. Stephen Dawson (Labor); 2. Jacqui Boydell (Nationals); 3. Ken Baston (Liberal); 4. Kyle McGinn (Labor); 5. Robin Scott (One Nation); 6. Robin Chapple (Greens).
Click here for preference distribution spreadsheet

Out of 49,311 formal votes, Robin Chapple’s win for the Greens in Mining and Pastoral came down to margins of 189 votes over Labor at the penultimate count, and 736 over Shooters Fishers and Farmers at the end. The quota was 7045, of which Labor had two off the bat, the Nationals and Liberals one apiece. One Nation got there when the exclusion of Australian Christians unlocked preferences from the Liberals, whose group voting ticket had the Christians second and One Nation third. The final seat came down to Shooters (3507 votes), Greens (2873), Labor #3 (2821), Nationals #2 (2380) and Flux the System (2478), who gathered the micro-party preference snowball. Nationals preferences then flowed to Shooters, and the Flux pinata scattered every which way, leaving the score at Shooters 6563, Greens 3854 and Labor 3665. Labor preferences then flowed to the Greens, who finished with 7389 to the Shooters’ 6653. A different Liberal preference strategy might have elected Shooters ahead of One Nation, or Labor #3 ahead of the Greens (though not both).

North Metropolitan

1. Alannah MacTiernan (Labor); Peter Collier (Liberal); 3. Martin Pritchard (Labor); 4. Michael Mischin (Liberal); 5. Alison Xamon (Greens); 6. Tjorn Sibma (Liberal).
Click here for preference distribution spreadsheet

Labor slightly outpolled the Liberals, with each electing two candidates off the primary vote. However, preferences from Family First and Liberal Democrats pushed the third Liberal, Tjorn Sibma, ahead of the third Labor, Kelly Shea, by 33,298 votes to 31,561. Had they not done so, Sibma would have dropped out and his preferences would have elected One Nation to the fifth seat, followed by Shea’s exclusion and Xamon’s election to the sixth seat. As it transpired, Xamon was elected to the fifth seat after Shea’s exclusion with a large surplus, which then flowed to Sibma ahead of One Nation.

South Metropolitan

1. Sue Ellery (Labor); 2. Nick Goiran (Liberal); 3. Kate Doust (Labor); 4. Pierre Yang (Labor); 5. Aaron Stonehouse (Liberal Democrats); 6. Simon O’Brien (Liberal)
Click here for preference distribution spreadsheet

Lynn MacLaren actually polled a greater share of the vote than three of her four elected Greens colleagues, and increased her vote from 2013. But she fell victim to a Goldilocks-in-reverse performance by Labor, who were neither strong enough to bequeath a big surplus to the Greens after the election of their third candidate, as they were in East Metropolitan, nor weak enough to fall below three quotas, as they were in North Metropolitan. Addition of below-the-line votes to the count added 0.6% to the Greens and took 0.3% from the Liberals, but it also took 0.7% from Labor, which flowed through to MacLaren. At the final count, the second Liberal, Simon O’Brien, led MacLaren by 51,332 to 47,591, with a quota of 49,570.

The most vulnerable point for the Liberal Democrats was the exclusion of the Daylight Saving Party, who had been given second preference by everyone in the Glenn Druery network. The Liberal Democrats had 14,105 at that point compared with 13,112 for Daylight Saving, and then received the latter’s preferences as the last party standing in the Druery network. That pushed them ahead of Australian Christians and One Nation, and the preferences of the latter put them well over a quota with 59,150. Their surplus of 9580 votes then went mostly to O’Brien ahead of MacLaren, deciding the result.

South West

1. Sally Talbot (Labor); 2. Steve Thomas (Liberal); 3. Adele Farina (Labor); 4. Colin Tincknell (One Nation); 5. Colin Holt (Nationals); 6. Diane Evers (Greens).
Click here for preference distribution spreadsheet

Labor elected two candidates off full quotas and the Liberals one, with first One Nation and then the Nationals building up to quotas as various parties’ preferences were distributed. The third Labor candidate, John Mondy, began with a slight lead over Diane Evers of the Greens in the race for the remaining seat, but preferences from Animal Justice and three of the Glenn Druery bloc parties (Daylight Saving, Fluoride Free and Flux the System) pushed Evers ahead, and Mondy’s eliminiation and preference distribution secured her the seat.

Western Australian election count endgame

As Labor locks in 41 seats in the lower house, the past form of below-the-line votes suggests some interesting new possibilities in the upper.

Saturday 4.50pm

And now the North Metropolitan preference distribution. The danger spot for the third Liberal, Tjorn Sibma, was the point at which the third Labor candidate, Kelly Shea, was excluded. At this point, Sibma had 33,298 votes to Shea’s 31,561. Had this been reversed, Sibma would have dropped out and his preferences would have elected One Nation to the fifth seat; after which Shea would have dropped out, and Xamon would have been elected to the sixth seat. As it transpired, Xamon was elected to the fifth seat after Shea’s exclusion with a large surplus, which then flowed to Sibma ahead of One Nation.

Saturday 4.10pm

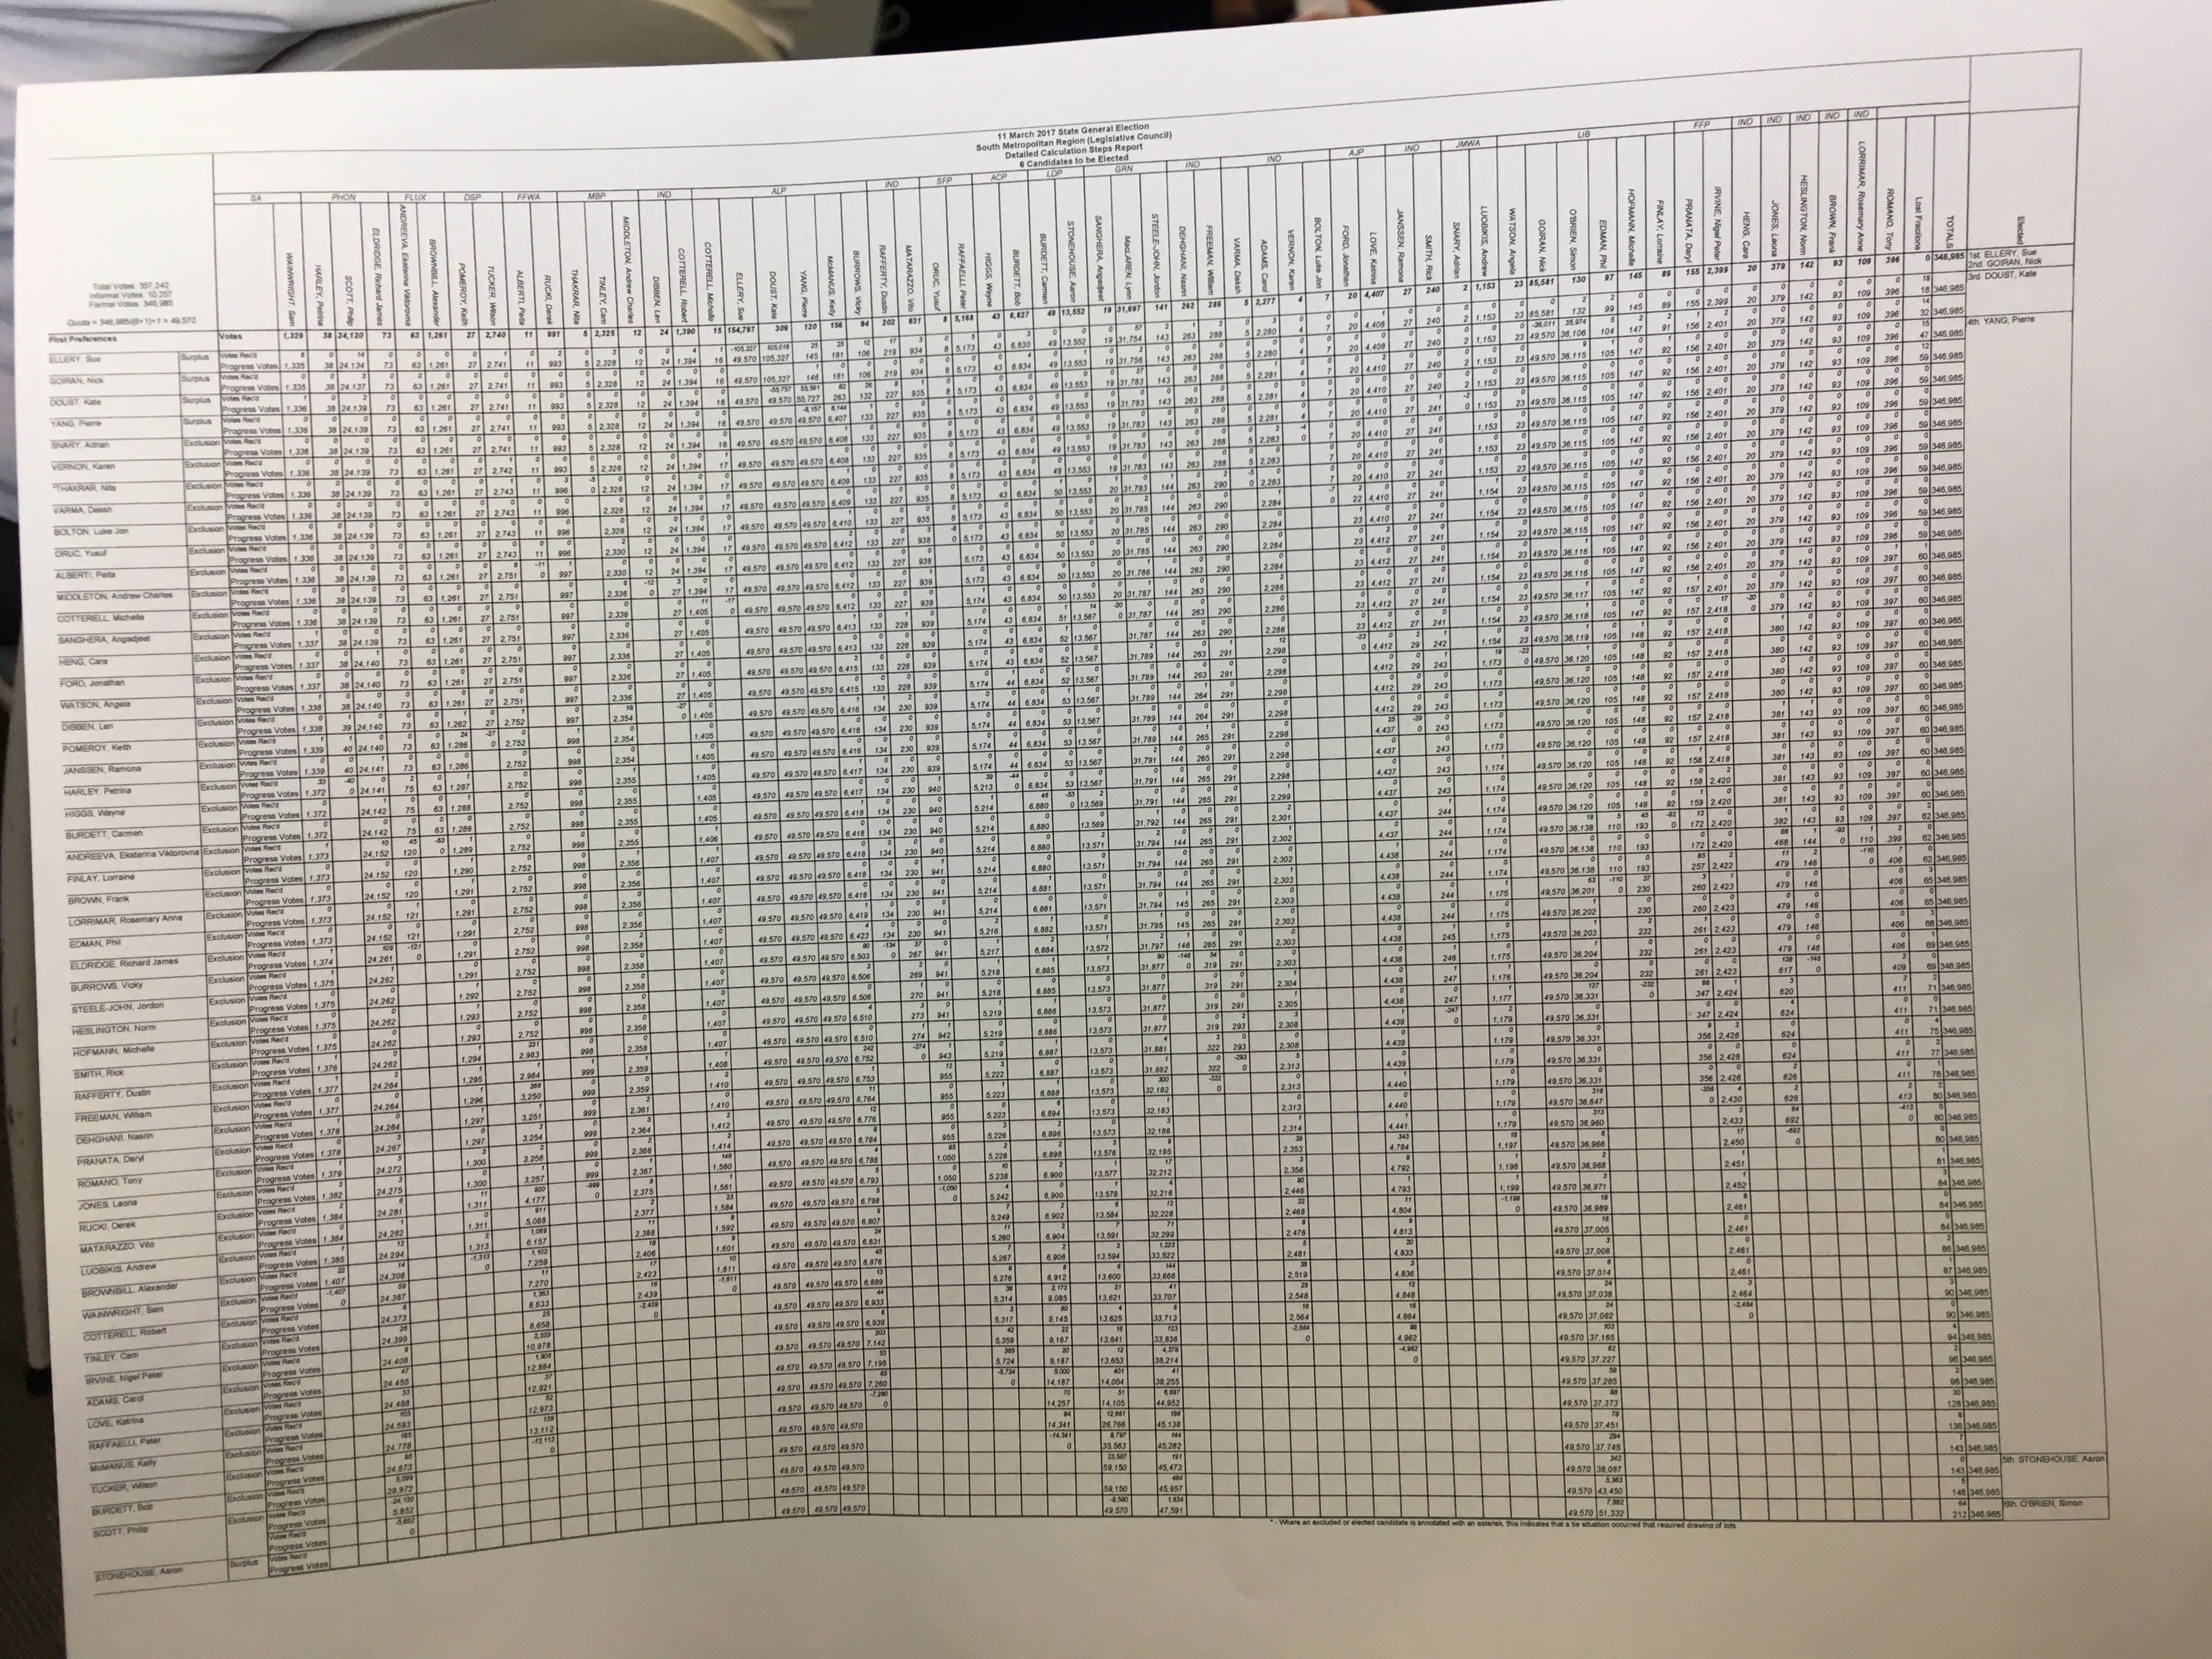
Here’s a pic of the South Metro distribution (HT: Grahame Bowland). With a quota of 49,570, the Liberal #2, Simon O’Brien, emerged with 51,332 to 47,591 for Lynn MacLaren of the Greens. The most vulnerable point for the Liberal Democrats was the exclusion of the Daylight Saving Party, who had been given second preference by everyone in the Glenn Druery network. The Liberal Democrats had 14,105 at that point compared with 13,112 for Daylight Saving, and then received the latter’s preferences as the last party standing in the Druery network. That pushed them ahead of Australian Christians and One Nation, and the preferences of the latter put them well over a quota with 59,150. Their surplus of 9580 votes then went mostly to O’Brien ahead of MacLaren, deciding the result.

Saturday 3.55pm

North Metropolitan: Liberal 3, Labor 2, Greens 1. Final result: Labor 14, Liberal 9, Nationals 4, Greens 4, One Nation 3, Shooters 1, Liberal Democrats 1.

Saturday 3.15pm

South Metropolitan: Labor 3, Liberal 2, Liberal Democrats 1. So Lynn MacLaren defeated, and Labor and the Greens only to total 18 in the chamber of 36. Simon O’Brien re-elected for the Liberals, and the government’s efforts to persuade him to become President set to begin in earnest.

Saturday morning

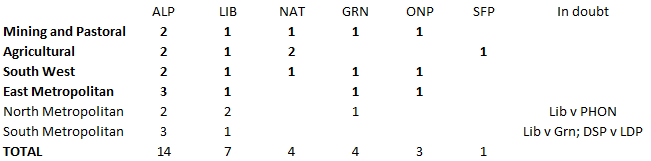
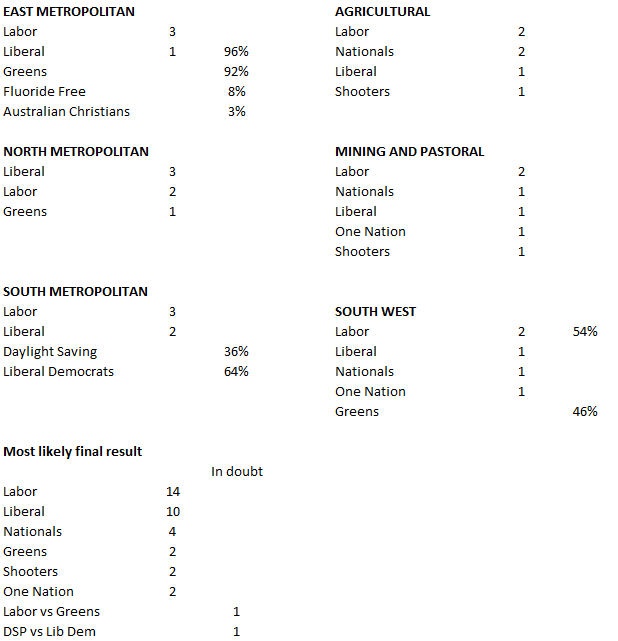
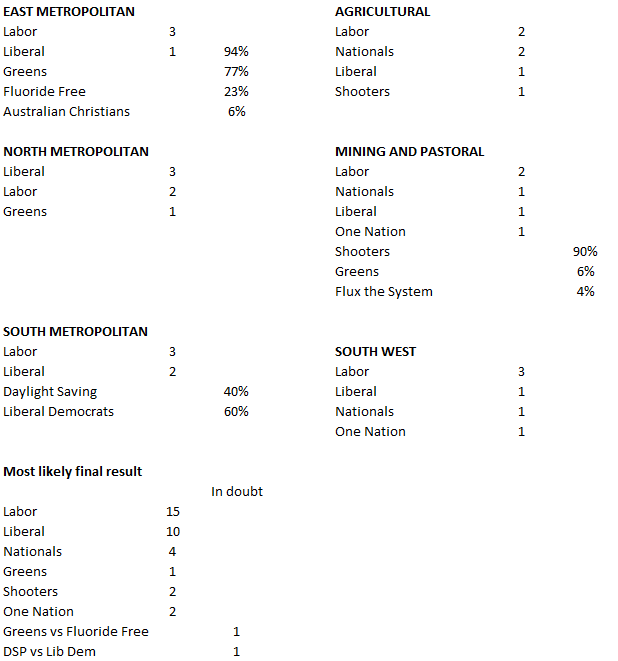
Results below show the four regions that have been called, plus my readings of the situation in the two that haven’t been.

For those of you who have just joined us, yesterday delivered the shock result in East Metropolitan of One Nation’s Charles Smith squeezing out Liberal incumbent Alyssa Hayden for a result of Labor three, Liberal one, Greens one, One Nation one. Two counts remain to be conducted, and are scheduled to take place this afternoon: South Metropolitan and North Metropolitan. South Metropolitan is particularly interesting, as a Labor-Greens majority depends on Lynn MacLaren of the Greens overturning a lead for the second Liberal candidate, Simon O’Brien, based on the above-the-line vote. It also remains to be established who out of the Liberal Democrats and the Daylight Saving Party will become the election’s sole beneficiary of Glenn Druery’s preference network. I was earlier floating the possibility of One Nation edging out a Liberal in North Metropolitan, while not doing so in East Metropolitan. However, the situation in North Metropolitan is different in that One Nation is relying on the Liberals to drop out before Labor, and so far it’s been Labor that has been losing more ground on below-the-lines.

Friday evening

The preference distribution sheet for East Metropolitan can be viewed here, and One Nation’s shock win can now be understood. It was not, as most of us initially assumed, due primarily to unusual behaviour by below-the-line votes, the addition of which took 0.5% from the Liberals’ vote share and 1.0% from Labor, while adding 0.7% to the Greens and making little difference to One Nation. Rather, it was due to an overlooked technical peculiarity of the counting system used in Western Australia, which produced a different result from what would have occurred in the Senate.

When a distribution of a candidate’s preferences occurs in the Senate, either due to their exclusion or their election (applying only to their surplus votes in the latter case), all the relevant votes are usually redistributed before the count moves on to the next step. The exception is when some of the votes being transferred have been reduced in value because they have already been partly used to elect somebody. In this case, distinct counts are conducted for each bundle of votes with a particular transfer value, in order from highest to lowest, each of which can end with a candidate reaching a quota and being elected.

But in Western Australia, each bundle of votes received, regardless of transfer value, constitutes a distinct count. This has become consequential now that we have micro-parties, in this case Fluoride Free, cobbling together large shares of the vote from a bewildering array of sources, in this case sufficient to turn their base vote of 1262 to 29,860 by the time they were excluded. Under the Senate system, all the votes accumulated by Fluoride Free would have been transferred in a single count, since all had a transfer value of one. The result would have been the election of Greens candidate Tim Clifford with a surplus of nearly 6500, mostly in form of the party’s own votes and preferences from Labor, which would then have flowed to the Liberals.

What happened instead was that Fluoride Free’s preferences were dealt out incrementally, up until the point where Clifford crept over the line. If I understand the situation correctly, the Fluoride Free votes were passed on in the order in which they had received them — first their own votes, then preferences from five small-fry independents (most or all of whom were fronts for the Glenn Druery bloc), the Julie Matheson group, Flux the System and the Daylight Saving Party, of which all but Matheson and one of the independents had the Greens ahead of One Nation. The votes accumulated by Clifford to this point where then used up in electing him, and no surplus was transferred.

However, many more of Fluoride Free’s preferences remained to be distributed, and proceeded to do so at their full value between the only remaining candidates: One Nation’s Charles Smith, on 35,759 votes, and the second Liberal, Alyssa Hayden, on 36,718. These were the larger transfers Fluoride Free had received later in the count, and they included the 4552 votes of Animal Justice, which would have mostly been spent electing Tim Clifford under the Senate method, but instead went to Smith ahead of Hayden. Also favouring Smith were the 8292 votes Fluoride Free had received from Australian Christians, 6491 from Shooters and 2269 from the Micro Business Party. Only the Liberal Democrats, with 3355, and Family First, with 3201, had favoured Hayden.

The vote recorded at the final count is 48,178 votes for Smith and 43,327 for Hayden, but the more telling point is that Smith’s score is only 347 votes clear of a quota. Still undistributed at the end of the count was the 1609 vote Greens surplus, which would have gone to Hayden, and 2388 remaining to Fluoride Free, which I’m unclear about.

Friday afternoon

5.45pm. I’m informed that that’s it for the day. South Metropolitan and North Metropolitan are now set to be finalised at 3pm tomorrow.

4.30pm. A shock in East Metropolitan — One Nation wins a seat at the expense of the second Liberal, for a result of Labor three and one apiece for Liberal, Greens and One Nation.

3.30pm. The WAEC is now going through South West, East Metropolitan and, most interestingly, South Metropolitan, with North Metropolitan to be conducted tomorrow. The South West result is in, and as expected, it’s two for Labor and one apiece for the Nationals, Liberals, Greens and One Nation.

Thursday evening

It seems the WAEC’s indication the four outstanding regions would be resolved today was over-optimistic, and we will now have to wait until tomorrow. The WAEC still hasn’t published the preference distribution files, but you can access them here for Agricultural and here for Mining and Pastoral. To summarise what happened:

Mining and Pastoral: Out of 49,311 formal votes, Robin Chapple’s win for the Greens in Mining and Pastoral came down to margins of 189 votes over Labor at the penultimate count, and 736 over Shooters Fishers and Farmers at the end. The quota was 7045, of which Labor had two off the bat, the Nationals and Liberals one apiece. One Nation got there when the exclusion of Australian Christians unlocked preferences from the Liberals, whose group voting ticket had the Christians second and One Nation third. The final seat came down to Shooters (3507 votes), Greens (2873), Labor #3 (2821), Nationals #2 (2380) and Flux the System (2478), who gathered the micro-party preference snowball. Nationals preferences then flowed to Shooters, and the Flux pinata scattered every which way, leaving the score at Shooters 6563, Greens 3854 and Labor 3665. Labor preferences then flowed to the Greens, who finished with 7389 to the Shooters’ 6653. A different Liberal preference strategy might have elected Shooters ahead of One Nation, or Labor #3 ahead of the Greens (though not both).

Agricultural: There were 88,175 votes in the count and a quota of 12,597. The Nationals started with two quotas, Labor and Liberal with one apiece. The micro-party snowball didn’t amount to much, with the Liberal Democrats going out before the Greens. Labor was then elected with preferences not just from the Greens, but also the Daylight Saving Party, Flux the System and the enigmatic Family First. Presumably this reflected a partial deal with the Glenn Druery bloc, in which the Liberal Democrats and Fluoride Free refused to participate. That left One Nation on 10,777, Shooters on 8,752 and Liberal #2 on 4,241, after which preferences from elected Labor and excluded Liberal went to Shooters, who defeated One Nation at the final count by 13,299 and 10,820. In other words, Liberal preferences could have elected One Nation if they had gone that way, but they actually had them third behind Shooters.

From these results, the effect of adding below-the-lines to the above-the-line totals is to add 0.3% to the Greens vote, and take 0.3% from the Liberals and 0.5% from Labor. If that was borne out in the other four regions, the One Nation possibility in North Metropolitan would disappear, as it is contingent on the Liberals falling behind Labor; and the Greens would fail to get ahead of Liberal #2 in South Metropolitan, in part due to a reduced Labor surplus, but would win their fight against Labor #3 in South West.

Thursday noon

The button has been pressed in Agricultural, delivering the long anticipated result of two Labor, two Nationals, one Liberal and one Shooters. The other four regions were, as of yesterday, scheduled to happen today.

Wednesday 2pm

We have the first finalised upper house result in, so I’m bumping this post. The Greens are relating that Robin Chapple has been re-elected in Mining and Pastoral, in what can only have been a close race against Labor’s third candidate, which presumably means a result of two for Labor and one apiece for the Liberals, Nationals, One Nation and Greens. More on that shortly. The other five regions, last I heard, are set to be determined tomorrow.

Monday morning

Preference counts have been completed and published for 21 of the 59 seats. The key point of interest relates to Kalgoorlie, where until now we could not be sure that the Liberals had won the seats over the Nationals, since there remained the possibility that the Liberal would fall out at the second last count. In the event, Liberal candidate Kyran O’Donnell had 8533 (34.7%) to 6656 (33.6%) for Labor’s Peter Forster, with Nationals candidate Tony Crook bowing out with 4812 (31.7%). With the distribution of Crook’s preferences, O’Donnell prevailed over Forster by 8533 (56.2%) to 6656 (43.8%).

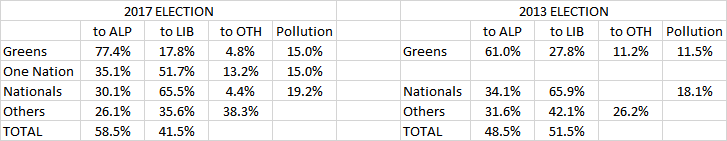
The tables below compare the behaviour of preferences from the 21 seats counted so far with those from all 59 seats at the 2013 election. This is done by adding together preferences as allocated from the relevant party’s point of exclusion, at which point there may or may not be candidates other than the two major parties to pass on preferences to. “Pollution” refers to the combined share of the vote passed on which the relevant party had acquired indirectly as preferences. One Nation preferences did appear to flow quite solidly to the Liberals, certainly in comparison with the federal election, where the split was all but 50-50 (11 of the 21 seats counted had One Nation candidates). Conversely, strong evidence emerges that Greens preferences flowed more heavily to Labor than in 2013. The only seats out of the 21 with Nationals candidates were Geraldton, Kalgoorlie and Murray-Wellington, which may not be representative.

Saturday

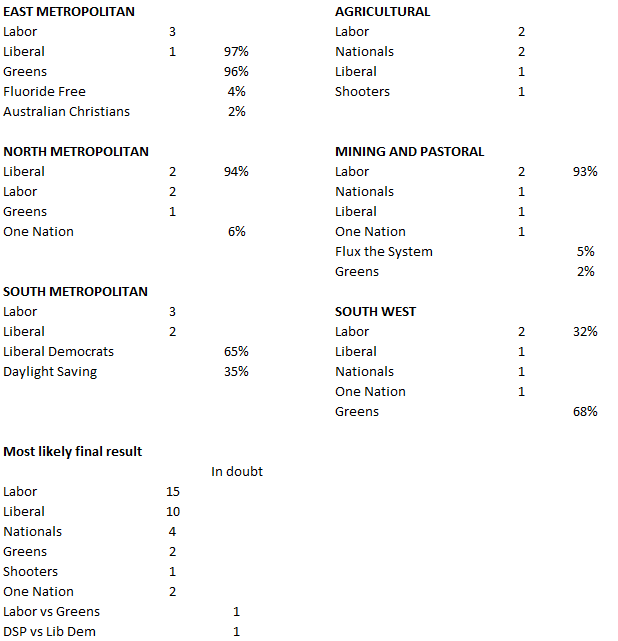
Formal distribution of preferences starts today, which presumably means we’re pretty much at the end of the primary vote count, so I haven’t bothered with another update of the results. The picture is clear, with all the close seats (Pilbara, Jandakot, Joondalup, Murray-Wellington and Kingsley) having broken to Labor. Still very much of interest though is the upper house, where we have the rather peculiar situation of what is presumably an all-but-complete count of above-the-line votes, but no information whatsoever on below-the-line votes. The latter are simply being put through the data entry process, without being used to update the first preference count. So we’re pretty much in a state of suspense until the button gets pressed, which is expected on Wednesday or Thursday.

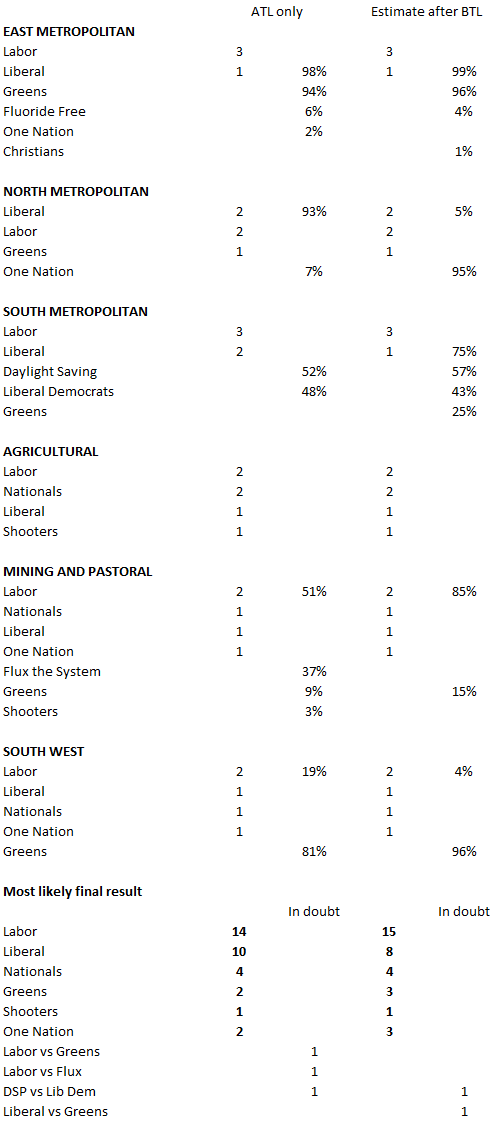
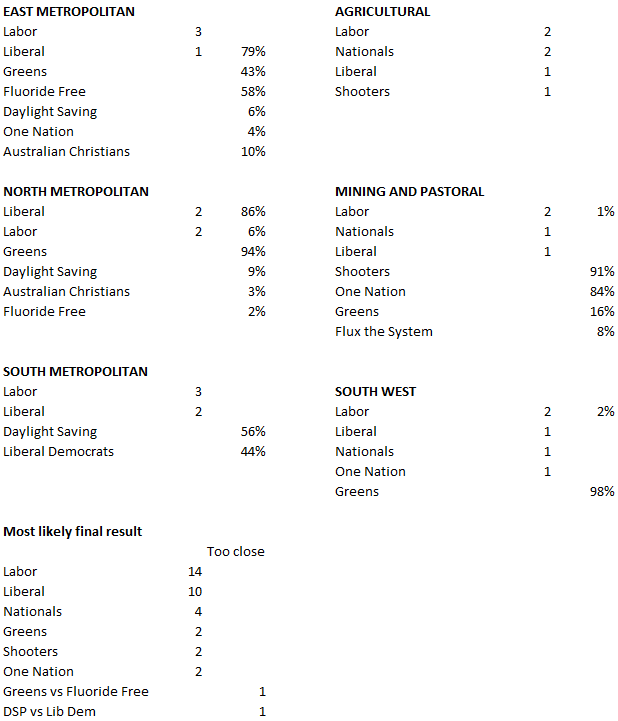
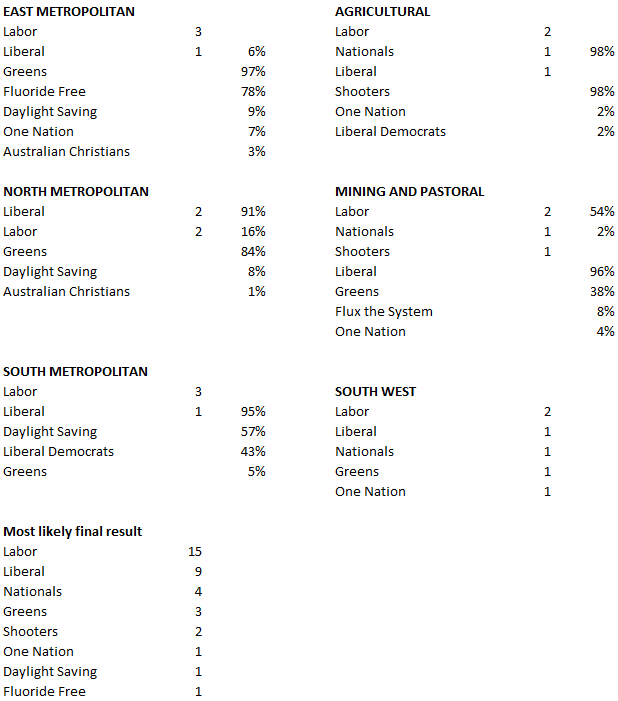
For this reason, I’m now offering two scenarios for my simulations – one based on the raw numbers currently in the system, and the other with rough adjustments made according to how much difference the addition of below-the-lines made to first preference totals in 2013. What this amounts to is an improvement for the Greens (who I’ve bumped 0.3% in Agricultural and Mining and Pastoral, and 0.6% everywhere else), and cuts for the Liberals (down 0.4% in Mining and Pastoral and 0.8% everywhere else) and the Nationals (down 0.4%).

This suggests the Greens are not out of the hunt in South Metropolitan, contrary to what the above-the-line projection has been suggesting, and could deprive the Liberals of a second seat in South Metropolitan — which is to say that it’s not out of the question that there could be a Labor-Greens majority. However, the politics of this are complicated by the fact that the second Liberal is Simon O’Brien, and reports yesterday suggested Labor hopes to tempt him with an offer of the President’s chair. Either way, Labor and the Greens between them would have 18 seats out of 35 on the floor, with the President only exercising a vote in the case of a tie (which would not arise when all members were present).

Another result to emerge from estimating the numbers inclusive of below-the-lines, which I was not expecting to see, is the fairly dramatic possibility of One Nation stealing the Liberals’ third seat in North Metropolitan. The ABC projection shows the danger point is after the exclusion of Family First at Count 19, leaving very little to separate the four remaining candidates: Greens (11.78%), Liberal #3 (10.48%), One Nation (10.45%) and Labor #3 (10.15%). So the Liberals only need to fall back by 0.33% at this point to be excluded, in which case their preferences would elect One Nation. Below-the-line votes should ensure the Greens keep their head above water here, so they look sure to take the other seat that’s outstanding at this point. My cursory examination of past form suggests One Nation at least holds its ground when below-the-lines are added, so this could get interesting.

In another development, the above-the-line projection now shows Labor in danger of losing its third seat in Mining and Pastoral to Flux the System and the micro-party preference snowball, but that won’t happen if below-the-lines behave as they normally do. I’ve also got the Greens improving in the race for the final seat in South West at the expense of Labor #3.

ReachTEL: 53-47 to federal Labor in Western Australia

A new poll conducted in WA records very substantial federal wash-up from state Labor’s landslide last weekend.

The weekend edition of The West Australian has results of a ReachTEL poll of federal voting intention in Western Australia, presumably conducted on Thursday night. It shows Labor with a lead of 53-47, which if borne out would amount to a 7.6% swing compared with last year’s election. I’m not sure about a federal poll conducted in the immediate aftermath of a state election, but there it is. More detail to follow.

UPDATE: After exclusion of 3.2% undecided, the primary votes are Liberal 38.7%, Nationals 5.1%, Labor 35.7%, Greens 11.6% and One Nation 5.3%. The poll also finds Malcolm Turnbull leading Bill Shorten 54.5-45.5 as preferred prime minister; Turnbull rated very good or good by 29.3%, average by 37.2% and poor or very poor by 33.5%; Shorten respectively coming in at 27.7%, 36.7% and 35.6%; and 75.5% rating it very important, 17.0% somewhat important, 5.6% “indifferent” and 1.9% not at all important that Western Australia get a bigger share of GST revenue. The poll was conducted on Thursday from a sample of 1554.

Photo finishes: lower house

Progressive updates on late counting for lower house seats in the Western Australian election.

Thursday

The same story continues as before: all close seats flowing decisively to Labor through remarkably strong results on absents. Today’s batches have broken 523-371 in Jandakot, 296-214 in Joondalup, 221-206 in Kingsley and 425-326 in Murray-Wellington, putting their respective leads at 677, 309, 312 and 514.

Wednesday

The Liberals’ litany of bad news continues, with Kingsley, Murray-Wellington and Joondalup continuing to slip beyond their grasp on the back of a surprisingly large and consistent trend to Labor on absent votes. The ABC computer today called Kingsley and Murray-Wellington to Labor, leaving only Joondalup in doubt (along with Kalgoorlie, where the battle is between Liberal and the Nationals).

Jandakot. Labor’s lead up from 459 to 505 as absents (191-162), postals (194-188) and pre-polls (29-18) all go their way.

Joondalup. Labor’s lead now out today from 77 to 227, with absents (721-570) again doing a surprising amount of damage, but postals (165-146) going Labor’s way as well. Pre-polls went 39-19 to Liberal.

Kingsley. Labor’s lead goes from 195 to 303 as absents break 449-328, more than cancelling out an advantage to the Liberals of 221-200 on postals. Pre-polls went 23-15 to Labor.

Murray-Wellington. Labor’s lead up from 288 to 430 as absents go 716-512 to Labor, postals go 196-139 to Liberal, and pre-polls go 14-9 to Liberal.

Pilbara. Brendon Grylls’s deficit up from 585 to 624, as absents (187-171) and postals (60-36) both favour Labor, with pre-polls going 25-24 in favour of Grylls.

Tuesday

Another bad day for the Liberals, whose position has deteriorated in a number of seats as absent votes are added to the count. In particular, Jandakot has defied my earlier suggestion that postal votes would save Francis, to the extent that Joe Francis has conceded defeat. Labor won 59.1% out of 1332 absent votes counted today, presumably because they are coming more from the Canning Vale end of the electorate than Leeming. In Joondalup, the latest batch of absents has gone 293-226 to Labor, helping increase their lead from 17 votes to 77. In Kingsley they have today favoured Labor 283-222, cancelling out a 218-155 advantage to the Liberals on postals, with Labor’s lead edging from 191 to 195. In Murray-Wellington, 624 absents, postals and pre-polls have had little impact on Labor’s margin, which goes from 308 to 288. The other big news of the day was Brendon Grylls’ concession in Pilbara, where his deficit today grew from 505 to 585, as absents and especially pre-polls flowed against him.

Monday

The ABC computer is now listing five seats in doubt, having today called Geraldton for Liberal and Pilbara for Labor. One of the doubtful is the Nationals-versus-Liberal contest of Kalgoorlie, where the ABC computer is projecting a comfortable Liberal winning margin of 4.2%. However, this is based on a speculative preference estimate, as no notional two-party count is being conducted, so we won’t know exactly what’s happened here until the end of the count. That leaves four outstanding Labor-versus-Liberal contests that will determine Labor’s final tally of between 37 and 40 in the house of 59. I’ll also keep at least a lazy eye on Baldivis, where independent Matt Whitfield has finished ahead of the Liberals and could maybe pull off a miracle if he gets an extraordinarily strong flow of preferences over serial Labor bridesmaid Reece Whitby.

This thread will cover the progress of the late count in these seats, in progressively greater detail as I get my act together. I’ll also continue running my upper house simulations on a daily basis on the existing post.

Jandakot. Liberal leadership aspirant Joe Francis trailed by 26 votes on election night, and now trails by four. My feeling is that Francis will get up, as the first 840 postals have behaved fairly typically in going 54.4% his way, and there should be plenty more where they came from. Labor has picked up 52.6% of the first 582 absents, but the behaviour of absents tends to be uneven depending on where particular batches came from, and the ones counted so far may be uncommonly strong for Labor. The same may be true of the first 536 pre-polls, which have so far broken to Labor in similar fashion to postals, although it’s of concern to Francis that these so far have been less favourable to him (in relative terms) than they were in 2013.

Joondalup. Labor’s 187 vote margin on election night has whittled down to 17. There are now 3338 pre-polls in the count, which is presumably most of them, and they have gone 52.2% to Liberal member Jan Norberger. However, 350 absents broke 350-201, which probably reflects the fact that the strongest Liberal areas are on the coast, so there is less tendency for voters there to wander over the boundary and vote in neighbouring electorates. This could prove to be a worry for Norberger, but it’s balanced on his strong 55.3% share of 1348 postals counted so far. A big question, which I am unable to answer, is how many of these are likely to be outstanding.

Kingsley. After trailing by 317 votes on the night, Liberal front-bencher Andrea Mitchell has rallied by picking up 56.4% of 1031 postals, reducing the margin to 191.

Murray-Wellington. A 415 Labor lead on election night is down to 308, mostly on account of Liberal member Murray Cowper picking up 57.7% of 769 postals. However, a possible fly in his ointment is Labor’s 60.9% share of the first 156 absents, which may reflect the fact that these are more likely to come from the Bunbury and Mandurah ends of the electorate.

Lower house call of the board

A quick seat-by-seat tour of last night’s McGowanslide.

Every seat in alphabetical order, with commentary where there’s anything that needs saying. See the post below this one for my first take on the Legislative Council.

Albany. Before: Labor 1.0%. After: Labor, unknown. I’m a little confused here, because the Nationals rather than the Liberals finished second here, and the WAEC presumably only conducted a Labor-versus-Liberal two-party count, which has been pulled from their site. So I can only assume the Labor-versus-Nationals result displayed on the ABC site is based on Antony’s estimate, and not as I first suspected a rebadged Labor-versus-Liberal result. Certainly the margin displayed is more what would expect from a Labor-versus-Nationals count, i.e. lower. If so, the result for Watson is better than the swing makes it appear – more like an 8% than 5.5%. That’s still more remarkable given that Watson’s excellent electoral performance in the past presumably meant he didn’t have as much slack to take up.

Armadale. Before: Labor 9.6%. After: Labor 25.0%.

Balcatta. Before: Liberal 7.1%. After: Labor 5.8%. Labor’s defeat here was their first in a history going back to 1962, and the swing was fairly typical for Perth.

Baldivis. Before: Labor 6.1%. After: Unknown. Reece Whitby hasn’t completely shaken off the electoral bogey that followed him through two failed bids for Morley, as he is being run fairly close by independent Matt Whitfield. In this he has suffered from the collapse in the collapse of the Liberals, who went from 33.1% to 14.2% and finished third. Whitfield would win the seat if he got 82.6% of the preferences from the Liberals, One Nation (7.0%), Greens (5.1%) and the rest (5.8%). The ABC projection is crediting him with two-thirds, but Carol Adams got around three-quarters under similar circumstances in Kwinana, from which Baldivis draws most of its voters. She also did very badly on absent votes, for some reason. Presumably a Labor-versus-independent vote will be conducted tomorrow, and I won’t be calling this until I see it.

Bassendean. Before: Labor 5.1%. After: Labor 21.7%.

Bateman. Before: Liberal 23.1%. After: Liberal 10.0%.

Belmont. Before: Liberal 1.0%. After: Labor 13.2%. Another seat Labor lost for the first time in 2013, and has now recovered with a vengeance on the back of a regulation 13.2% swing.

Bicton. Before: Liberal 10.0%. After: Labor 2.4%. Dean Nalder’s determination to contest Bateman instead was vindicated by a fairly typical 12.4% swing, contrary to impressions that the Perth Freight Link might make a difference one way or the other.

Bunbury. Before: Liberal 12.2%. After: Labor 11.3%. The Liberal vote fell 30.6% in John Castrilli’s absence to 45.3%, translating into a devastating 23.4% swing to Labor. The Nationals campaigned pretty hard here but only gained 6.5%, and finished well behind the Liberals in third.

Burns Beach. Before: Liberal 11.3%. After: Labor 2.7%. Environment Minister Albert Jacob gained the notionally Labor seat of Ocean Reef when he entered parliament in 2008, and now he’s lost its reconfigured successor on the back of a fairly typical 14.1% swing.

Butler. Before: Labor 1.0%. After: Labor 19.9%. John Quigley’s 18.9% swing is particularly notable given he only suffered a 1.1% swing in 2013.

Cannington. Before: Labor 2.1%. After: Labor 18.7%.

Carine. Before: Liberal 18.3%. After: Liberal 9.9%.

Central Wheatbelt. Before: Nationals 8.9% versus Liberal. After: Nationals unknown. The Liberal vote went from 31.2% to 11.0%, which presumably reflects conservative voters falling in behind Nationals member Mia Davies, who was up slightly, now she’s the sitting member. A former upper house MP, she came to the seat in 2013, filling the vacancy created by Brendon Grylls’ move to Pilbara. The Liberals fell to third, so the notional count was redundant, and the two-party result on the ABC computer is presumably an estimate.

Churchlands. Before: Liberal 20.0%. After: Liberal 14.6%.

Cockburn. Before: Labor 4.6%. After: Labor 16.2%.

Collie-Preston. Before: Liberal 2.9%*. After: Labor 13.9%. Big swings here across the board as Mick Murray effortlessly retained a seat that had been made notionally Liberal by the redistribution, but the biggest of all were in suburban Bunbury.

Cottesloe. Before: Liberal 21.1%. After: Liberal 13.8%. Swings were relatively modest in the wealthy western suburbs, including the one against the Premier.

Darling Range. Before: Liberal 13.1%. After: Labor 5.4%. A well above par 18.4% swing delivered Labor one of its strongest wins, and typified the Liberal collapse in the outer suburbs.

Dawesville. Before: Liberal 12.7%. After: Labor 1.6%. A nervous debut for Zak Kirkup, who succeeds former Deputy Premier Kim Hames.

Forrestfield. Before: Liberal 2.2%. After: Labor 9.6%. A slightly below average swing, but plenty enough to take out a fragile Liberal margin in this eastern Perth seat.

Fremantle. Before: Labor 15.4%. After: Labor 24.0%. Of academic here of interest is who finishes second out of Liberal and the Greens – the Liberals are on 20.0% and Greens are on 18.1%, and presumably preferences won’t close the gap. Labor’s Simone McGurk won a clear majority on the primary vote.

Geraldton. Before: Liberal 10.9% versus Nationals. After: Liberal 0.8%. The ABC computer says the swing here is 10.1%, but it’s wrongly measuring the Liberal-versus-Labor result from this election with the Liberals-versus-Nationals result from the last. The real figure is 22%, which appears to have brought Labor to just short of victory in a seat where they finished third in 2013. Nationals candidate Paul Brown, who was seeking to move from the upper house, came in third.

Girrawheen. Before: Labor 2.8%. After: Labor 16.7%.

Hillarys. Before: Liberal 16.0%. After: Liberal 3.9%. Liberal-turned-independent Rob Johnson came in third with 21.0% to Labor’s 28.2%. Liberal candidate Peter Katsambanis, with 39.7%, would have been in big trouble if he had got ahead of Labor and soaked up their preferences.

Jandakot. Before: Liberal 18.3%. After: Labor 0.1%. Liberal leadership hopeful Joe Francis going right down to the wire here, with absents and outstanding postals to decide the result. Based on the past form of such votes, my guess would be that he will sneak over the line.

Joondalup. Before: Liberal 10.4%. After: Labor 0.5%. The 11.0% swing against Liberal member Jan Norberger was fairly modest by outer suburban standards, and he may yet hang on.

Kalamunda. Before: Liberal 10.3%. After: Labor 3.1%. A typical 13.3% swing was sufficient to tip out Health Minister John Day out, and deliver Labor a seat it had never before held (it existed from 1974 to 1989, and has done so again since 2008).

Kalgoorlie. Before: Nationals 3.2% versus Liberal 10.3%. After: Unknown. The ABC computer says the Liberals will gain this from the Nationals with a margin of 5.1%, but this assumes these will be the last two candidates, when there’s an effective three-way tie between Labor, Liberal and Nationals from the top three positions. I believe it’s also based on an estimated preference flow, since there’s no two-party result shown on the WAEC site. For what it’s worth, I wouldn’t have thought Labor and One Nation preferences would have favoured the Liberals. Nationals candidate Tony Crook will certainly win if preferences cause the Liberals to finish third.

Kimberley. Before: Labor 5.1%. After: Labor 8.8%. Unclear here who finishes second out of Liberal and Nationals, but Labor goes untroubled either way. The swing was relatively mild, as it was in 2013.

Kingsley. Before: Liberal 14.0%. After: Labor 0.8%. Labor with their nose ahead in a close race in a seat they had only previously won in 2005, after a fairly normal 14.9% swing.

Kwinana. Before: Labor 18.5%. After: Labor 4.3%. At his third election, incoming Deputy Premier Roger Cook finally goes undisturbed by independent Carol Adams.

Maylands. Before: Labor 2.7%. After: Labor 18.4%.

Midland. Before: Labor 0.5%. After: Labor 13.0%. An easier night for Michelle Roberts this time around.

Mirrabooka. Before: Labor 4.6%. After: Labor 19.2%.

Moore. Before: Nationals 5.9% versus Liberals. After: Nationals 8.7% versus Liberals.

Morley. Before: Liberal 4.7%. After: Labor 12.1%. A particularly big swing in a seat Labor didn’t expect to lose in 2008, and couldn’t win back in 2013.

Mount Lawley. Before: Liberal 8.9%. After: Labor 3.8%. A regulation swing tips out the Liberals in a seat that wouldn’t have responded too favourably to the One Nation preference deal.

Murray-Wellington. Before: Liberal 12.0%. After: Labor 1.1%. Labor looks like it’s done enough in a seat it has only won in the past when it was more oriented to Mandurah, with a mid-range 13.1% swing.

Nedlands. Before: Liberal 19.1%. After: Liberal 8.8%.

North West Central. Before: Nationals 11.5%. After: Nationals 8.8%. I think the WAEC conducted a Nationals-versus-Liberal count that proved redundant because the Liberals crashed to third, so I guess the ABC figure is an estimate.

Perth. Before: Liberal 2.8%. After: Labor 12.5%. A particularly big 15.3% swing in a seat Labor was always going to recover, perhaps reflecting an inner-city One Nation preference deal effect.

Pilbara. Before: Nationals 11.5%. After: Labor 1.4%. I called this seat for Brendon Grylls on ABC Radio, so I’m a bit perplexed that the preference count has him trailing Labor by 1.4% at the end of the night. Preferences overall appear to be splitting evenly, which is pretty extraordinary given their make-up: Liberal 14.6%, One Nation 11.1%, Shooters 9.9%, Greens 3.8%.

Riverton. Before: Liberal 12.7%. After: Liberal 4.5%. Another relatively mild swing in a stronger Liberal seat.

Rockingham. Before: Labor 13.2%. After: Labor 23.9%.

Roe. Before: Nationals 16.7% versus Liberal. After: Liberal 14.9% versus Nationals. This is a new seat that essentially merges Wagin, held by Terry Waldron of the Nationals, and Graham Jacobs, a Liberal. Waldron didn’t contest, but Jacobs was nonetheless unable to put the Nationals under serious pressure.

Scarborough. Before: Liberal 17.3%. After: Liberal 5.1%.

South Perth. Before: Liberal 20.0%. After: Liberal 7.7%.

Southern River. Before: Liberal 10.9%. After: Labor 8.6%. A massive swing to Labor in an area that also moved heavily in their favour at the federal election.

Swan Hills. Before: Liberal 3.7%. After: Labor 14.2%. Always a very likely Labor gain, but went well beyond the call of duty with a swing of 17.9%.

Thornlie. Before: Labor 1.8%. After: Labor 15.9%.

Vasse. Before: Liberal 21.1%. After: Liberal 15.0%.

Victoria Park. Before: Labor 4.0%. After: Labor 16.6%.

Wanneroo. Before: Liberal 11.0%. After: Labor 8.0%. The one seat where the Liberals really hoped the One Nation preference deal might do them some good returned a 19.0% swing, in another example of the outer suburbs effect. One Nation polled 9.6% — a look at their preference flow will have to wait for tomorrow.

Warnbro. Before: Labor 10.6%. After: Labor 24.2%.

Warren-Blackwood. Before: Nationals 7.2% versus Liberal. After: Nationals 12.0%. Another former Nationals-versus-Liberal contest where the Liberals fell to third.

West Swan. Before: Liberal 0.9%*. After: Labor 18.5%. Made notionally Liberal by the redistribution, but swung fully as forcefully as neighbouring Swan Hills.

Willagee. Before: Labor 2.5%. After: Labor 16.4%.

Upper house call of the board

Labor’s landslide has carried over to a better-than-expected showing an upper house, but an assortment of micro-party cross-benchers promises to make life complicated.

Thursday night

For the second time, I’m withdrawing what had earlier been called a sure result, with a seat earlier attributed to the Shooters in Mining and Pastoral now credited almost certainly to Labor, with a trace chance for the Greens. This reflects the addition of remote booths to the count today, and makes it appear likely that Labor and the Greens between them will have 18 out of 36 seats. It’s significant that my earlier reversal was in South West, as these smaller non-metropolitan regions are more prone to dramatic movements in the count. I now have the Greens with the edge over Labor to take the seat that suddenly flipped to the left on Tuesday’s counting, although there’s still very little in it.

Wednesday night

Updated simulations below, with no fundamental change occurring anywhere on today’s counting. In South West, the key exclusion is at Count 20 on the ABC computer, at which the Greens are currently dropping out with 8.85% to Labor’s 9.20%. If the Greens were to finish ahead at this point, they rather than Labor’s #3 would win a seat.

Some idea on the progress count. Agricultural: 2760 counted today for a total of 69,793; 70.21% of enrolled voters counted, compared with a final total of 90.4% in 2013. East Metropolitan: 14,769 counted from a total of 276,487; 72.42% counted compared with 89.65% in 2013. Mining and Pastoral: 3124 counted today from a total of 37,644; 56.71% counted compared with 79.46% in 2013. North Metropolitan: 23,383 counted today from a total of 280,628; 73.66% counted compared with 89.69% in 2013. South Metropolitan: 15,195 counted today from a total of 285,401; 89.47% counted compared with 71.89% in 2013. South West: 7326 counted today from a total of 161,414; 73.72% counted compared with 90.67% in 2013.

Tuesday night

Yesterday’s bad day for the Greens has been followed by a much better one today. After being written off in South West yesterday, they have today roared back after a drop in the vote share for Labor, and are now rated a 46% chance of winning the last seat at the expense of Labr’s number three. They are also up from 77% to 92% in East Metropolitan, where a win over Fluoride Free depends on the latter dropping out behind One Nation at the key exclusion. At present, the ABC projection has One Nation leading at the relevant point by 9.60% to 8.86%. There was little change today in the race between the Liberal Democrats and the Daylight Saving Party in South Metropolitan, with the former still slightly favoured. The challenge for the Daylight Saving Party is to survive an exclusion ahead of Australian Christians, in which case preferences would push them past the Liberal Democrats. However, the ABC projection presently has Australian Christians leading 3.94% to 3.72%.

Monday night

Today’s run of my upper house count projections has produced a radical change in South West, where yesterday I had the Greens a 98% chance of winning the last seat versus 2% for Labor, but now I have it as all but a done deal for Labor. However, I now have the Greens slightly favoured in their race against Fluoride Free in East Metropolitan, which will come down to whether Fluoride Free can get their nose ahead of One Nation at the key cut-off point. I’ve arbitrarily halved the amount of variation I’m allowing for in randomising the results for purposes of my simulations, which has a lot to do with the fact that I’m listing clear-cut results in three of the six regions, and coming fairly close to doing so in Mining and Pastoral (though I’m told the Greens feel at least some cause for hope that below-the-line votes will get them up at the expense of Shooters).

As before, the table below lists “confirmed” seats in the left column and percentage changes of taking the remaining seat or seats (if any) in the second. The progress of yesterday’s count was as follows: 10,291 new votes in Agricultural, for a total of 60,682; 4476 in Mining and Pastoral, for 28,300; 15,426 in South West, for 126,801; 24,266 in East Metropolitan, for 234,477; 31,463 in North Metropolitan, for 236,862; 16,290 in South Metropolitan, for 236,885.

Sunday night

I’ve done another run of my simulations after today’s counting, of which there was a very great deal in Agricultural (from 13,315 votes counted to 50,391) but only modest amounts in North Metropolitan and South Metropolitan, with the other three regions coming somewhere in between (votes in the count increased by between 21% and 31%). I would probably have since this coming if I had done my homework carefully on where the outstanding votes were, but the Labor-Greens axis is looking weaker today due to a deteriorating position in East Metropolitan and Mining and Pastoral, with the latter now set to deliver a second seat to One Nation on top of their clear win in South West. The Liberals have gone from a weak chance for a second seat in East Metropolitan to a strong one, coming at the expense of either the Greens or Fluoride Free, both of whom looked strong yesterday and are now looking dicey. In Mining and Pastoral, yesterday it looked like Labor #3 or the Greens would win a third seat, but I’m now projecting that will likely go to One Nation instead, joining the Nationals, Liberals and Shooters on one seat apiece. This means a broadly conservative bloc of Liberal, Nationals, Shooters and One Nation stands to win exactly half the 36 seats, putting it in a position to win votes on the floor after Labor provides the President.

Saturday night

The Labor landslide looks to have carried over to a better-than-expected result in the Legislative Council, where Labor and the Greens seem likely to win half the 36 seats between them. Depending on how things pan out in Mining and Pastoral, that will be either Labor 15 and Greens three, or Labor 14 and Greens four. However, Labor will have to provide the President, who only gets a casting vote in the event of a tie on the floor, which tends not to happen because of the odd numbers once the President is taken out of the picture. So the government will need another vote on top of the Greens to get contentious measures through — including, perhaps, measures related to the reform of the chamber’s malapportionment and electoral system.

The Liberals look to have crashed from 16 seats to nine, while the Nationals are down from five to four. That leaves another five cross-benchers on top of the three or four Greens. As I write at the close of business, the ABC computer is crediting the Daylight Saving Party with a seat in Mining and Pastoral, but this is because it is misidentifying Stefan Colagiuri as the party’s candidate, when he is in fact from Shooters Fishers and Farmers, who appear set to win two seats. However, the Daylight Saving Party might yet win the seat the ABC is crediting to the Liberal Democrats in South Metropolitan. There are also non-trivial chances of other disturbances to the current picture. One Nation should at least win a seat in South West, and the micro-party preference network looks a good chance to deliver Fluoride Free a seat in East Metropolitan.

I’ve run simulations based on the current voting numbers with randomised variations to test for the likelihood that results will differ from those shown by the ABC calculator. These are shown below, with confirmed wins in the first column and probabilities of winning one of the outstanding seats in the second.

Western Australian election live

A thread for discussion of the Western Australian election count.

And they’re off. Polls have closed, and the first results should be in in half an hour or so. I’ll be part of ABC Radio’s coverage, which you can hear on local radio in Western Australia and around the country on News Radio. Here’s a thread for you all to discuss the action as it occurs.

Newspoll and ReachTEL: 54-46 to Labor in Western Australia

One day out, Labor maintains its election-winning lead in Western Australia, according to the final Newspoll.

Final polls:

• Courtesy of The Australian, Newspoll’s final poll has Labor maintaining the 54-46 lead it recorded at the start of the campaign, with results all but identical to those recorded a week ago in the Galaxy Research poll for the Sunday Times, which is conducted by the same organisation. The latest poll has Labor on 41%, compared with 40% from Galaxy; the Liberals on 32%, compared with 31%; the Nationals steady on 5%; One Nation on 8%, compared with 13% in the previous Newspoll, and 9% from Galaxy; and the Greens on 7%, compared with 8%. However, respondents appear to be marking Mark McGowan more harshly now, as he is down one on approval to 45% and up six on disapproval to what I believe to be a new high of 40%. Conversely, Barnett has been on an upward trend from a low base, his approval rating progressing from 28% in November to 32% in late January to 34% now, while disapproval was 61% in November and has been 57% in the last two polls. He has also narrowed the gap on preferred premier, from 47-29 to 44-32 to 45-37.

• ReachTEL in tomorrow West Australian also has it at 54-46 two-party preferred, after an out-of-step poll three weeks ago had it at 50-50. After filtering out the 3.5% undecided, the latest poll has Labor on 41.8%, Liberal on 33.9%, the Nationals on 6.0%, One Nation on 6.8%, the Greens on 6.5% and others on 4.9%. A range of further questions finds Labor modestly favoured to handle the economy, the budget, crime and infrastructure, and solidly more so in relation to social services. A question on whether the Liberals should have entered a preference deal with One Nation had 22.3% and 60.7% disagree, though a fair bit of this is presumably hostility towards preference deals generally. The poll was conducted from a sample of 2573 on Thursday night.

If you’re searching for my take on the progress of counting this evening, you can find it on ABC News Radio or local stations in Western Australia, where I’ll be calling the race with the ABC’s Geoff Hutchison and Belinda Varischetti, and a shifting line-up of Labor and Liberal politicians.